

24 Apr IB ESS IA Rubric Explained: Criteria, Mark Scheme & 2026 Guide
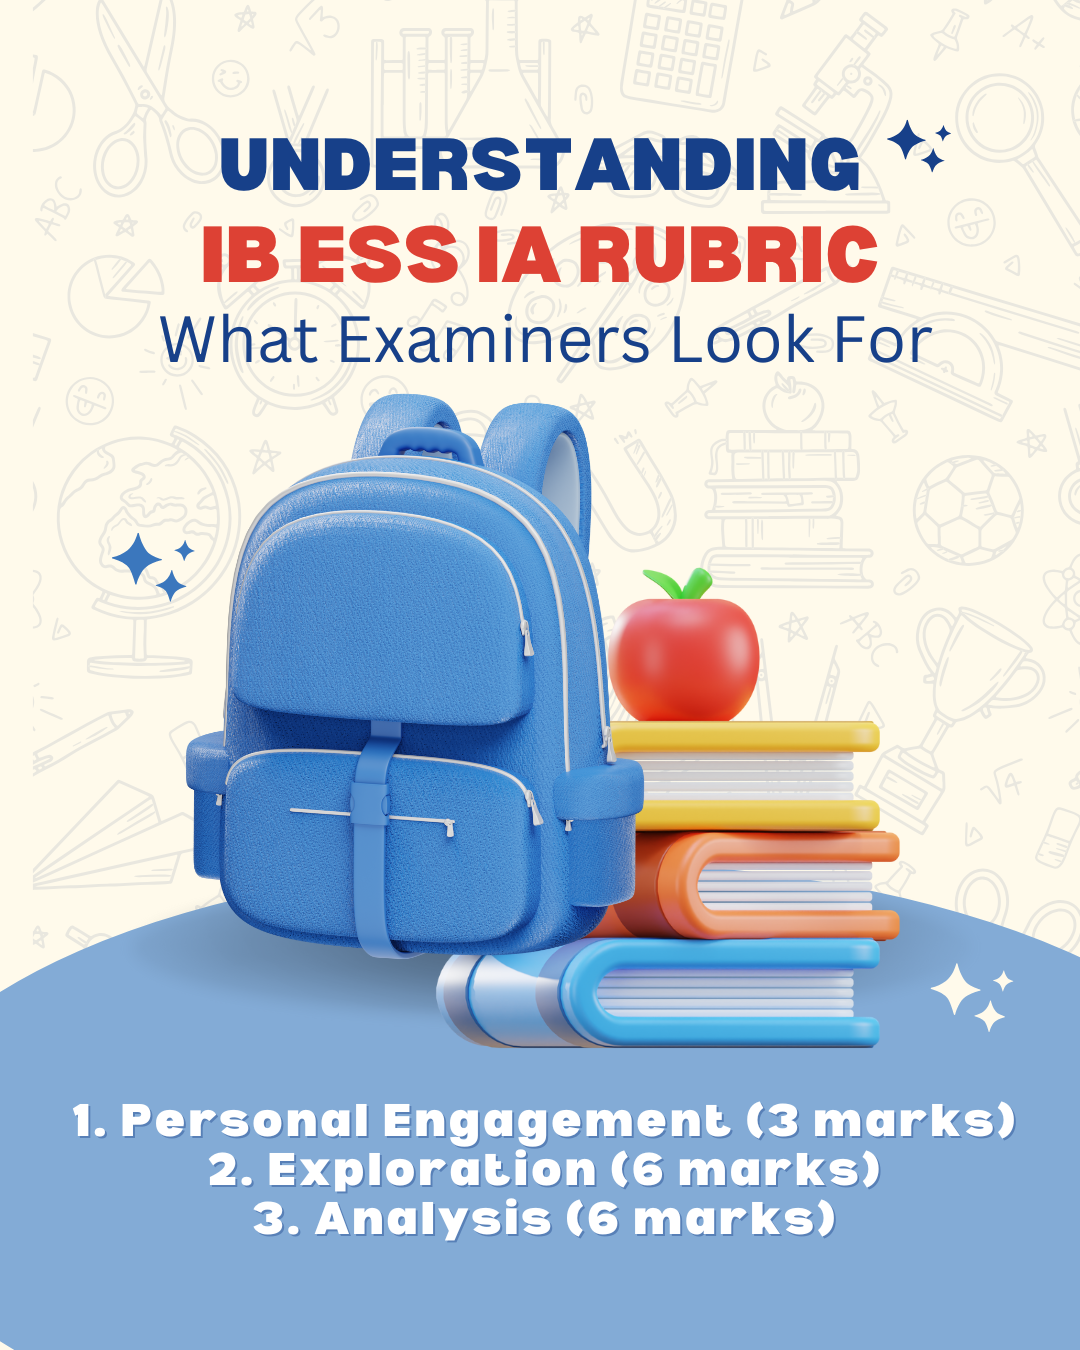
24 Apr Understanding the IB ESS IA Rubric: What Examiners Look For
When examiners assess your Environmental Systems and Societies (ESS) Internal Assessment (IA), they look for several key criteria to evaluate your work. Here’s a breakdown of what they focus on when it comes to the IB ESS IA Rubric:
Personal Engagement (3 marks)
Personal Engagement is worth 3 marks and rewards genuine interest and initiative, not just following a template. Examiners check whether you chose and shaped the investigation yourself.
- Pick an issue tied to a place or habit you actually know, like local water use, a nearby wetland, or your school’s waste system, instead of a generic textbook example.
- Explain, in your own words, why the question matters to you or your community, not just why it’s important for the environment.
- Show initiative in your method: note a decision you made yourself, such as adapting a sampling technique because the original plan didn’t fit your site.
- Reflect briefly on a problem you solved during data collection, like adjusting your timing after a failed first attempt.
Examiners aren’t scoring enthusiasm in the abstract. They’re looking for specific, personal choices that prove the investigation is yours, not copied from a sample IA.
Analysis (6 marks)
Analysis is worth 6 marks, scored across three aspects: recording data, processing data, and presenting processed data, each marked 0 to 2.
Recording data (0-2 marks)
- 2 marks: data is recorded systematically, with appropriate units, covering both quantitative and qualitative evidence where relevant.
- 1 mark: recorded data has mistakes or omissions.
- 0 marks: data isn’t recorded, or is recorded incomprehensibly.
Processing data (0-2 marks)
- 2 marks: primary and/or secondary data is processed correctly.
- 1 mark: processing has errors.
- 0 marks: no processing is carried out, or major mistakes are made.
Presenting processed data (0-2 marks)
- 2 marks: processed data is presented clearly and effectively to support analysis.
- 1 mark: presentation lacks clarity or contains some mistakes.
- 0 marks: presentation is inappropriate or incomprehensible.
A sample raw data table should record every trial with units in the header, not the cells:
| Site | Trial 1 (mg/L) | Trial 2 (mg/L) | Trial 3 (mg/L) | Mean (mg/L) |
|---|---|---|---|---|
| Site A | 4.2 | 4.0 | 4.3 | 4.17 |
| Site B | 2.1 | 2.3 | 2.0 | 2.13 |
From there, processed data should show your working, such as a standard deviation or percentage change calculation, and a processed graph with clear axis labels and units.
For limitations and sources of error, be specific rather than general:
- Name the actual source: a specific piece of equipment, a timing constraint, or a sample size that was smaller than planned.
- State its likely effect on the results, such as underestimating a value or increasing variability between trials.
- Avoid vague lines like human error may have occurred without saying where.
For suggestions for improvement, tie each one directly to a limitation you named:
- If equipment limited precision, suggest a specific alternative instrument or calibration step.
- If sample size was small, suggest a realistic larger sample for a repeat study.
- If timing affected results, suggest repeating the investigation across a different season or time of day.
Examiners reward improvements that follow logically from your own limitations, not generic suggestions that could apply to any investigation.
Analysis (6 marks)
Data Collection: The data must be well-organized and comprehensive. Examiners look for clarity in how you collect and present the data (e.g., tables, graphs) and if it’s sufficient to answer the research question.
Limitations and Sources of Error: Examiners want to see that you’ve thought about any limitations in your experiment or errors that could have affected the results. This includes potential biases, human error, or equipment limitations.
Suggestions for Improvement: Examiners value constructive feedback in this section. You should suggest realistic ways in which your experiment could be improved, or how future research could build on your findings.
Where to Find the Official IB ESS IA Rubric and Mark Scheme
The ESS IA criteria document sets out the exact mark breakdown for each criterion, including the 0-2 descriptors covered for Exploration and Analysis. You can download it directly as a PDF.
Keep it open alongside your draft and check each aspect against your own report before submitting, since matching the exact wording of a descriptor is often what separates a 1 from a 2.
IB ESS IA Example: Structure and Tips
A practical IA structure to follow:
- Research question: one focused sentence naming your variables.
- Variables and controls: what you’re changing, measuring, and holding constant.
- Method: sampling steps, equipment, and sample size.
- Data: raw data table, then processed data with calculations.
- Analysis: what the processed data shows in relation to your question.
- Limitations and improvements: specific sources of error and realistic fixes.
For a closer look at how real investigations apply this structure, see these ESS IA examples.
If you’re stuck turning a rubric descriptor into an actual paragraph, one-on-one ESS and IB Geography tutoring can walk through your draft criterion by criterion.
No Comments