

30 Sep Score IB ESS Marks With a 4 Step r and K Strategists Paragraph
r-strategists put their energy into rapid reproduction: many small offspring, fast maturation, and short lives suited to unpredictable habitats. K-strategists put their energy into survival: fewer offspring, longer development, and greater parental investment suited to stable, competitive habitats. Most real species exhibit life history traits that fall along a spectrum between these two extremes, so treat r and K as a spectrum, not two boxes.
TL;DR:
- Most species exhibit traits along a spectrum between r-strategists and K-strategists, rather than fitting neatly into one category.
- The logistic growth model explains how r- and K-strategist traits result from a population approaching or remaining near carrying capacity.
- Traits such as early maturation, high fecundity, and short lifespan are typical of r-strategists, while K-strategists invest heavily in fewer, long-lived offspring.
- Habitat stability influences life history strategies, with unpredictable environments favoring r-selected traits and stable habitats favoring K-selected traits.
- Modern ecology now favors a continuous fast-slow spectrum over the strict r/K dichotomy, emphasizing trade-offs in development, reproduction, and mortality risk.
Table of Contents
- 1. What do r and K actually mean biologically?
- 2. The logistic growth equation behind r and K
- 3. Survivorship curves and real species across the tree of life
- 4. Why ecologists moved beyond a strict r/K split
- 5. Using r and K correctly in your IB ESS answers
- 6. Why I still teach r and K, with caveats
- How personalized IB ESS tutoring helps with life history topics
- Sources
- FAQ
1. What do r and K actually mean biologically?
The letters come straight from population ecology. r is the intrinsic rate of increase: how fast a population grows when resources are unlimited. K is the carrying capacity: the maximum population size a habitat can sustain long term. An r/K selection theory overview explains that r-selected species are built to push r as high as possible, while K-selected species are built to survive and compete once a population nears K.
That single difference in emphasis produces two very different life history packages. r-strategists tend to reproduce early, produce large numbers of offspring, invest little in each one, and live short lives. K-strategists reproduce later, produce few offspring, invest heavily in each one through extended parental care, and live longer.
You will meet these traits again and again in IB ESS questions, so it helps to fix them as a short comparison:
- Fecundity: r-strategists produce large numbers of offspring per reproductive event; K-strategists produce very few.
- Parental care: r-strategists give little to none; K-strategists invest heavily, sometimes for years.
- Maturation age: r-strategists mature quickly, often within days or weeks; K-strategists mature slowly, sometimes over a decade or more.
- Lifespan: r-strategists are typically short-lived; K-strategists are typically long-lived.
- Body size: r-strategists tend to be small-bodied; K-strategists tend to be large-bodied.
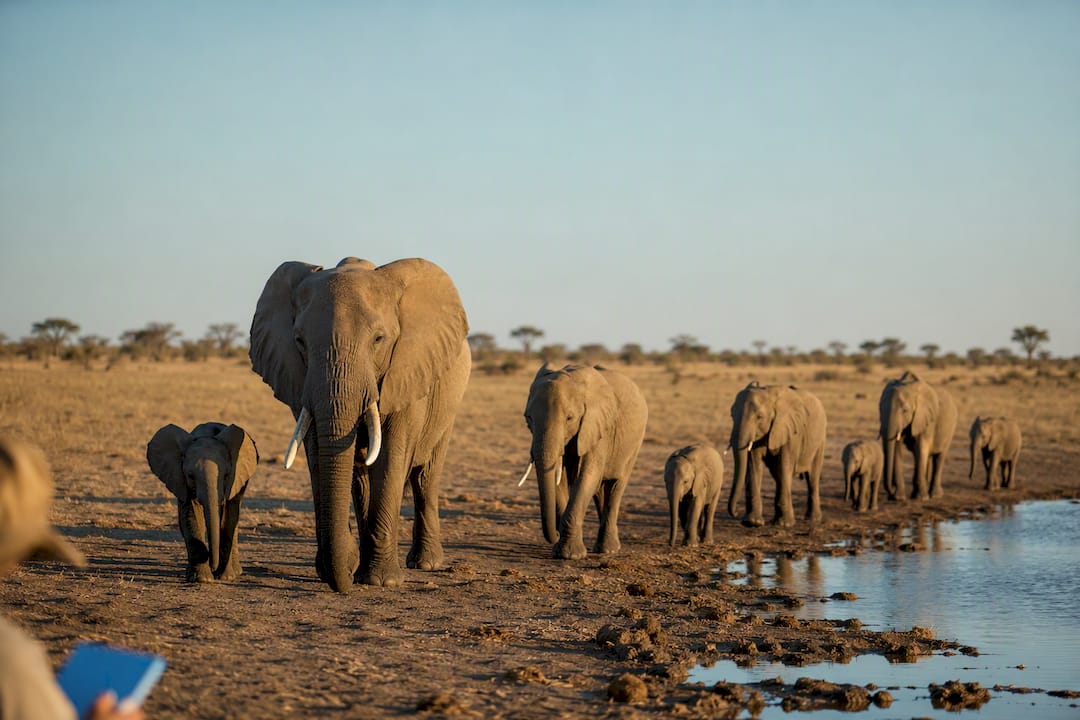
Classic examples on the r side include bacteria, aphids, and dandelions. On the K side, K-selected species include humans, elephants, whales, and sharks, all of which invest heavily in fewer, longer-lived offspring. Some organisms blur the line entirely: oak trees live for centuries like a K-strategist but scatter thousands of acorns like an r-strategist, which is exactly the kind of nuance examiners like to see acknowledged.
2. The logistic growth equation behind r and K
The math behind this model is worth learning properly, because it explains why the traits cluster the way they do rather than asking you to memorize them as arbitrary lists. The logistic growth model is written as:
dN/dt = rN(1 − N/K)
- N is the current population size, the number you are tracking over time.
- r is the intrinsic rate of increase, the maximum per capita growth rate when resources are abundant.
- K is the carrying capacity, the ceiling the environment can support.
- The term (1 − N/K) is the brake: as N approaches K, this fraction shrinks toward zero and growth slows.
When N is small relative to K, that braking term is close to 1, so growth is close to exponential. That is the r-strategist’s world: colonize fast, before the brake kicks in. When N is close to K, growth flattens into an S-shaped curve, which is the K-strategist’s world: compete efficiently near the ceiling rather than race to reach it.
Picture two populations starting from the same small number. One has a high r and shoots up steeply before leveling off at K, like a bloom of bacteria hitting the limits of a petri dish. The other has a lower r and rises gradually toward K, like an elephant population that grows slowly for decades before density-dependent limits like food and space stabilize its numbers. Sketching that S-curve, and being able to say why it flattens, is a reliable way to earn method marks in a written response.

3. Survivorship curves and real species across the tree of life
Life history strategy also shows up in survivorship curves, which plot the proportion of a population surviving at each age. According to LibreTexts’s overview of life history traits, r-strategists often produce Type III curves, with high early mortality and few survivors reaching old age, while K-strategists more often produce Type I curves, with low early mortality and most individuals surviving to old age. Type II curves, a fairly constant death rate across life stages, sit between the two and describe organisms like some birds and small mammals.
Habitat stability, not body size alone, is what the classic literature ties to r versus K outcomes. A foundational paper in ecological strategies and population parameters frames unpredictable, disturbance-prone habitats as favoring r-type traits and stable, resource-limited habitats as favoring K-type traits.
A few examples make the pattern concrete:
- Dandelions produce huge numbers of wind-dispersed seeds and colonize disturbed ground fast, a textbook r-strategy among plants.
- Oak trees live for centuries and invest in slow growth, yet still scatter enormous numbers of acorns, which is why they are often taught as an intermediate case.
- Jellyfish release vast numbers of planktonic larvae with no parental care, fitting the r pattern among invertebrates.
- Leatherback sea turtles lay hundreds of eggs per season like an r-strategist, but mature slowly and live for decades like a K-strategist, making them a favorite teaching example for mixed traits.
- Elephants mature over more than a decade, have single calves spaced years apart, and invest heavily in parental care, a clear K-strategy among mammals.
Trees and sea turtles are useful examples to illustrate that life history strategies form a continuum rather than strict categories, since both combine traits from each end.
4. Why ecologists moved beyond a strict r/K split
The strict r/K dichotomy was influential for decades, but later work found too many species that did not fit cleanly on either side. The same foundational ecological strategies paper notes that modern life history theory increasingly emphasizes trade-offs between development and reproduction, and the mortality risk an organism faces, as better predictors than a simple r/K label. A historical review of r- and K-selection status traces how the theory rose quickly, then was refined once ecologists tested it against real demographic data.
The replacement most commonly taught now is the fast-slow life history continuum, which ranks species by the pace of their whole life cycle, development speed, reproductive timing, and mortality risk, rather than sorting them into two camps. Age-structured demographic models add another layer, tracking survival and reproduction rates at each specific age rather than assuming one growth rate fits an entire population.
- Strict r/K predictions fail for species with mixed traits, such as trees and sea turtles.
- Mortality risk and developmental trade-offs now explain variation better than habitat type alone.
- The fast-slow continuum treats life history as a spectrum, which matches the biology far more closely.
Pro Tip: When you introduce r/K in an essay, state it as a useful heuristic in the same sentence you flag its limits: this signals evaluation skill rather than rote recall.
5. Using r and K correctly in your IB ESS answers
Examiners reward students who apply the model rather than just describe it. A strong paragraph moves from claim to evidence to explanation to qualifier.
- Open with a one-line definition and a stance: state what r and K mean, then commit to how your chosen example fits.
- Support with a specific example: pick a species whose traits you actually know, such as a dandelion or an elephant, and give one concrete detail (offspring number, maturation time).
- Explain the mechanism: connect the trait back to habitat stability or carrying capacity, not just to the label.
- Add a qualifier: note where the model breaks down, using an intermediate case like a sea turtle or oak tree.
For internal assessments touching on population ecology, choose a species with data you can actually measure or source, and link any life history trade-off you describe to real figures rather than assumption. That structure tends to target the evaluation and application criteria most directly.
Pro Tip: Marking these essays as an IB examiner, I look first for whether a student ties r and K back to the actual population parameters, growth rate and carrying capacity, rather than only listing memorized traits.
6. Why I still teach r and K, with caveats
I keep r and K in my lessons because they give students a fast mental hook for a genuinely complicated area of ecology. It is far easier to start from a clear contrast and add nuance than to start from a continuum with no anchor points at all.
What I ask students to do next is pair that hook with the fast-slow continuum and a specific example, ideally one with a known limitation like the leatherback turtle. That combination tends to produce the kind of layered, evaluative answer that scores well.
— Marija
How personalized IB ESS tutoring helps with life history topics
Life history strategy is one of those topics that looks simple until you have to apply it under exam pressure, choose the right species example, or defend a trade-off with real data in an IA. IB ESS and Geography HL and SL tutoring services and pricing built around your specific syllabus gaps can turn a shaky understanding of r and K into a confident, examiner-style answer.

A short trial session is a low-commitment way to see how a session runs before booking a full package.
- The trial plan runs 20 minutes for a one-off fee, enough time to work through one tricky concept like the r/K continuum.
- The basic plan runs a full 60-minute session for a one-off fee, suited to building a complete exam answer or IA section.
- Dedicated IA support for IB ESS helps if your investigation touches population growth, carrying capacity, or species life history data.
Sources
For readers who want the primary literature behind this article: the University of Chicago’s ecological strategies paper, the LibreTexts chapter on life history traits, and the 2019 nitrification modeling study on r/K dynamics in microbial competition.
- Patterns in life history traits — Biology LibreTexts
- R/K selection theory — Wikipedia
- Ecological strategies and population parameters — University of Chicago Journals
FAQ
What are K-strategists and r-strategists?
K-strategists invest in fewer, higher-survival offspring suited to stable, resource-limited habitats, while r-strategists invest in many low-investment offspring suited to unpredictable habitats. The labels come from the logistic growth model’s carrying capacity (K) and intrinsic growth rate ®.
What are some examples of K-strategists?
Elephants, whales, sharks, and humans are commonly cited K-selected species, since each matures slowly, has few offspring, and invests heavily in parental care. Oak trees are sometimes included as a partial example because of their long lifespan, though their seed output complicates a pure classification.
Which animals are known as r strategists?
Insects like aphids, many small fish, and jellyfish are classic r-strategists, producing large numbers of offspring with little or no parental care. Dandelions show the same pattern among plants, spreading huge numbers of seeds to exploit disturbed habitats quickly.
How do K and r strategists differ in reproduction and growth curves?
r-strategists reproduce early and often with many offspring, producing steep, exponential-style growth until resources run out, while K-strategists reproduce later with few offspring, producing a gradual S-shaped curve that levels off near carrying capacity. Survivorship also differs: r-strategists tend toward Type III curves with high early mortality, while K-strategists tend toward Type I curves with low early mortality.
No Comments