

16 Nov Correlation vs Causation in IB ESS: How to Analyse Data
When two environmental variables change together, it is tempting to say that one caused the other. In an IB ESS investigation, that conclusion needs evidence. A careful distinction between correlation and causation helps you interpret data accurately, evaluate limitations and write conclusions that your results can support.
What is correlation?
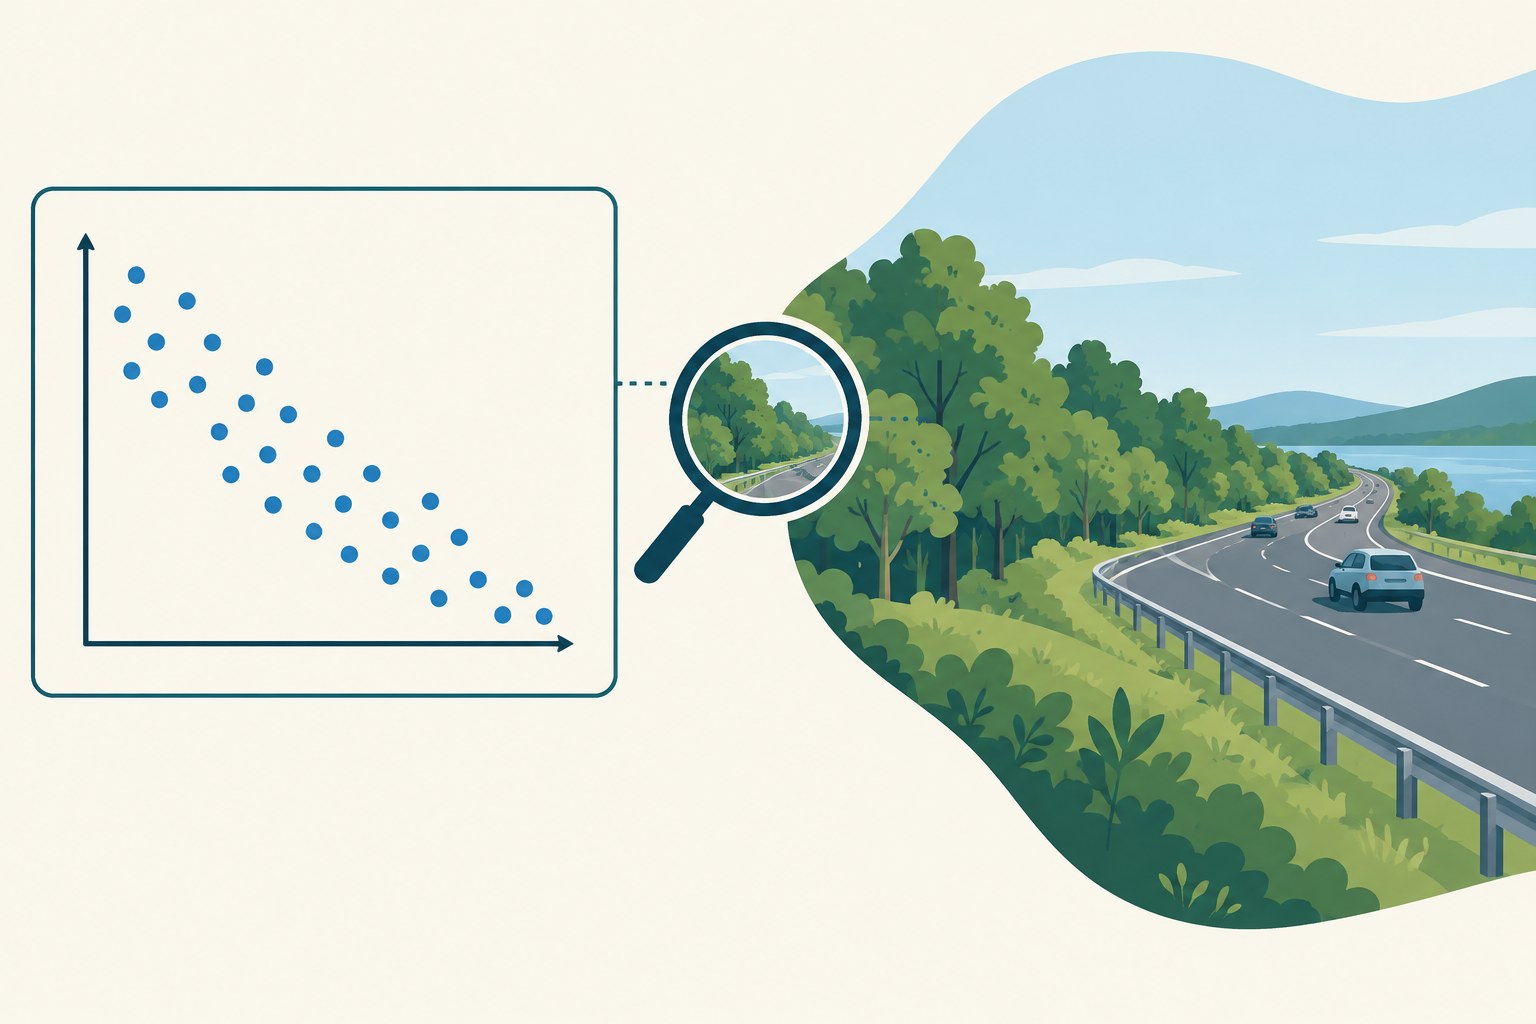
Correlation describes an association between two variables: when one changes, the other tends to change in a related way. The relationship may be positive, negative or weak. A scatter graph can help you see its direction and pattern; an appropriate statistical test may help quantify it.
For example, a student might observe that sites closer to a busy road have lower plant species richness. That is a pattern in the sampled data. By itself, it does not show that traffic pollution caused the difference.
Look at a scatter graph before relying on a single statistic. Check whether the points follow a roughly linear pattern, whether one outlier strongly affects the result, or whether the data form separate clusters. A correlation coefficient summarises a particular kind of relationship; it does not describe every feature of the data. Choose a statistical method that fits the variables and the pattern, and explain why it is appropriate.
Why does correlation not prove causation?
Other factors may influence one or both variables. In the road example, nearby sites might also differ in soil type, shade, mowing, foot traffic or habitat size. Any of these could help explain the observed pattern. These are potential confounding variables: factors that make it harder to isolate the relationship being studied.
There are also other possibilities. The relationship might be coincidental, the sample may not represent the wider area, or the direction of influence may be unclear. A correlation coefficient cannot identify the mechanism that produced a pattern.
This does not make correlational data useless. It can reveal a relationship worth investigating. The important step is to describe what the data shows without claiming more than the method can establish.
How to investigate an environmental relationship more carefully
Before collecting data, write down the two variables in your research question and list factors that could affect either one. Then plan how you will record or account for the most relevant factors.
For a road-noise and plant-richness investigation, define how noise will be measured, how plant richness will be counted and how far each site is from the road. Then consider shade, mowing, soil and foot traffic. You may not be able to control every factor in fieldwork, but recording relevant conditions helps you discuss whether they could influence the pattern.
Think about the limits of your sampling too. If all your sites are in one small area, the results may not represent other habitats or seasons. If some sites are easier to reach than others, convenience sampling could bias the comparison. A short pilot can reveal whether your equipment, timing and recording sheet work as planned before you commit to the full investigation.
- Define each variable. State exactly what you will measure, in which units and at what locations or times. “Pollution” and “biodiversity” are too broad until you operationalise them.
- Choose comparable sampling locations. Where possible, compare sites that are similar in habitat, management and physical conditions, while differing in the factor you are investigating.
- Use a consistent method. Keep equipment, timing, measurement technique and identification rules as consistent as possible. Record conditions that could affect the results.
- Plan sampling before you begin. Select locations systematically or randomly where appropriate, and justify the number of samples using your pilot, available time and the variability you observe. Repeated readings at one location are not automatically independent sites.
- Check the pattern before choosing a test. Plot the data, look for outliers and assess whether a statistical test fits your variables and research question. A test result does not replace interpretation of the graph or the environmental context.
- Keep the conclusion proportional. If your method is observational, use wording such as “was associated with” or “a relationship was observed.” Explain why a causal claim would need stronger evidence.
How to write about correlation in your ESS IA
A clear analysis moves from the evidence to a cautious interpretation. For instance:
“Across the sampled sites, plant species richness tended to be lower where measured traffic noise was higher. This indicates an association in this dataset. It does not establish that noise caused the difference because shade and mowing frequency were not fully controlled.”
Adapt the wording to your own results. Do not copy this example as a conclusion or present it as data you collected. State the direction and strength of the pattern only if your graph or analysis supports it, then discuss the most relevant limitation and its effect on confidence.
In the evaluation, make improvements specific. “Collect more data” is not enough on its own. Explain which sites or measurements you would add, how they would improve comparability or reduce uncertainty, and what practical limits would remain.
Quick checklist before you submit
- Have I defined both variables in measurable terms?
- Have I shown the relationship with a suitable graph or analysis?
- Have I considered plausible confounding variables?
- Does my conclusion describe an association, or do I have evidence for a causal claim?
- Have I explained how limitations affect what I can conclude?
Frequently asked questions
Can correlation prove causation in an ESS investigation?
No. Correlation shows an association in the data. To argue that one factor caused another, you need a design and evidence that address alternative explanations; many field investigations cannot control every factor.
What is a confounding variable in an ESS IA?
It is another factor that may influence the variables you are studying and make their relationship harder to interpret. Identify plausible confounders during planning and explain how they affect your results.
Do I need to prove cause and effect?
Focus on answering your own research question with the evidence you collected. If your method shows an association rather than causation, say so clearly and evaluate the limits of your conclusion.
For related guidance, see the guides to ESS IA data analysis, presenting ESS IA data and choosing an ESS IA method. Always check your school’s current instructions and the official IB guidance provided by your teacher.
No Comments