

17 Nov IB ESS Paper 2 Practice: Waste and Ecosystem Structure
IB ESS Paper 2 connects environmental knowledge with real systems, evidence and decisions. This practice article brings together questions on municipal waste and ecosystem structure for both Standard Level (SL) and Higher Level (HL) students. The prompts below retain the wording shown in the supplied question images. They include a data figure, short response questions and an evaluative question. No answers or markscheme are included.
Environmental Systems and Societies considers how natural processes and human choices interact. Waste management is one example: households, local authorities, businesses and national governments all influence how materials move through a system after use. Recycling, reuse, composting, landfill and incineration are different approaches, each connected to resource use, infrastructure, energy and environmental impacts.
Municipal waste includes waste collected by or on behalf of local authorities, commonly from households and similar sources. Recycling rates can vary between places and across time. They are influenced by collection systems, sorting facilities, markets for recovered materials, public participation and the composition of the waste stream. A percentage describes the share recycled, while the total quantity of waste generated is a separate measure. Comparing percentages therefore gives information about one part of waste management, rather than a complete account of material flows.
Waste-management systems also reflect differences in governance and infrastructure. Countries may set different targets, use different definitions and invest in different collection and treatment facilities. Urban density, household habits, local markets and the distance to processing sites can affect how a system operates. These factors sit within broader decisions about consumption, product design, resource efficiency and the responsibilities of producers and consumers.
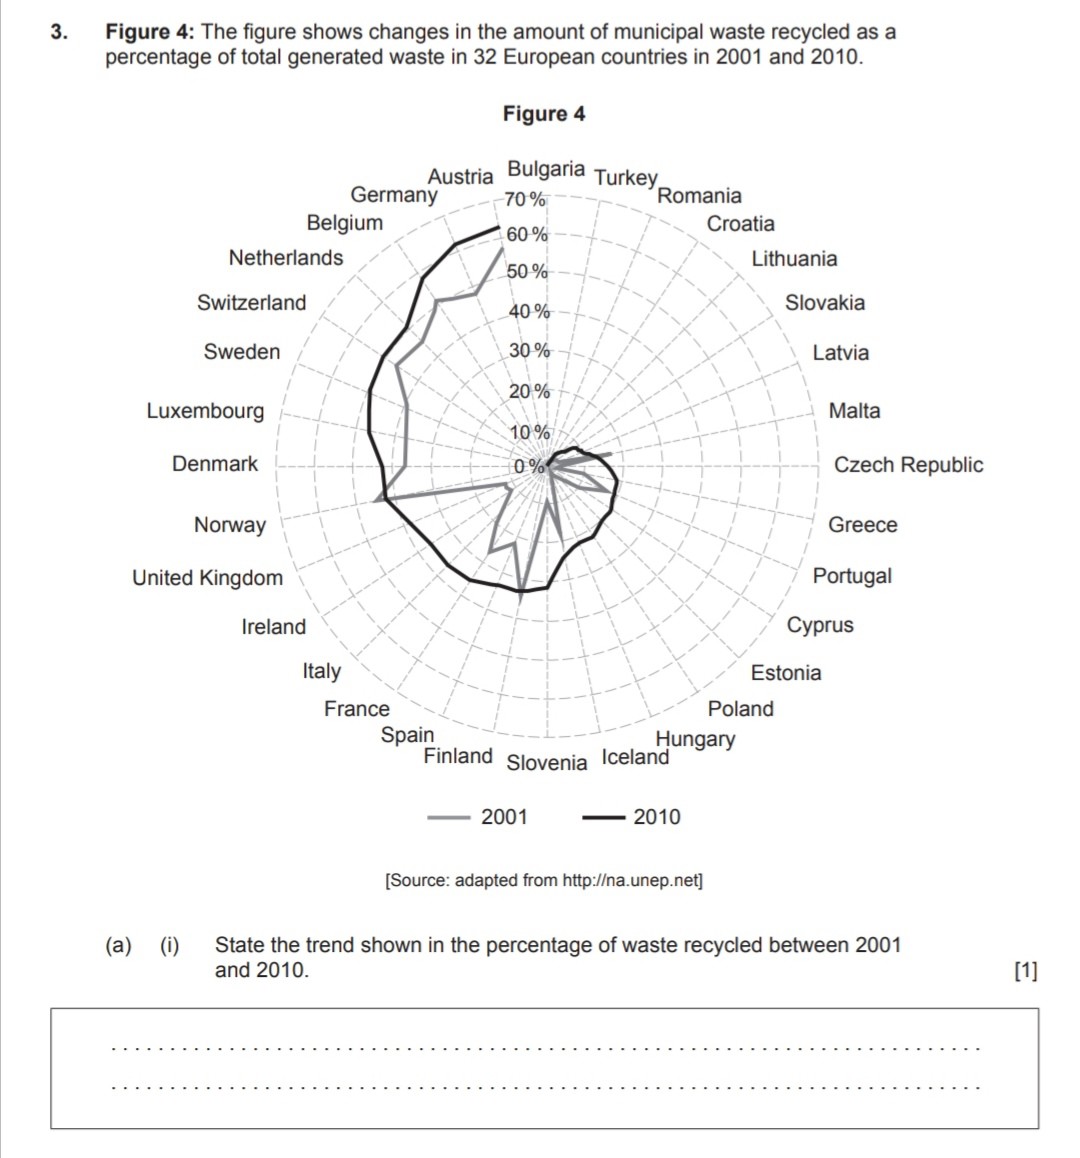
Figure 4: Municipal waste recycling in 32 European countries
The figure compares the percentage of total generated municipal waste recycled in 32 European countries in 2001 and 2010. It is presented as a radar chart, with each country positioned around the circle and two lines representing the two years.
Questions on the figure
Figure 4: The figure shows changes in the amount of municipal waste recycled as a percentage of total generated waste in 32 European countries in 2001 and 2010.
- (a) (i) State the trend shown in the percentage of waste recycled between 2001 and 2010. [1]
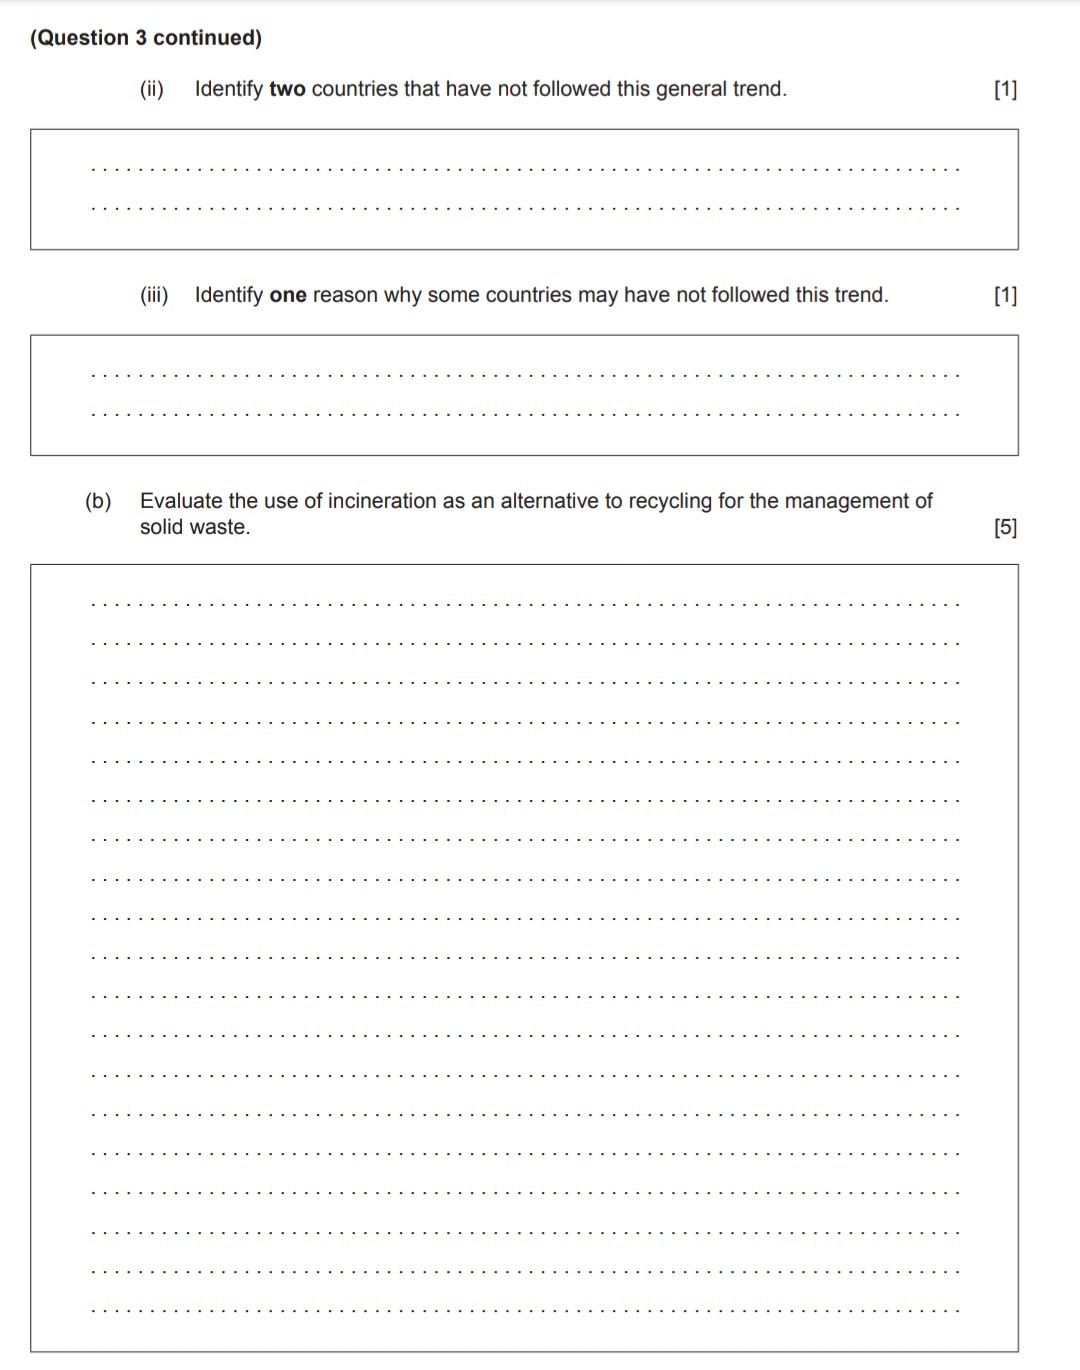
- (a) (ii) Identify two countries that have not followed this general trend. [1]
- (a) (iii) Identify one reason why some countries may have not followed this trend. [1]
- (b) Evaluate the use of incineration as an alternative to recycling for the management of solid waste. [5]
Recycling aims to recover materials so that they can re-enter production or use. The processes required differ across paper, metals, glass, plastics and organic matter. Collection and processing also require energy and infrastructure. The environmental effect of recycling depends in part on the material, its condition, the processing method and the system used to collect and sort it. Recovered material can reduce demand for some virgin resources, although markets and product design influence whether recovery is technically and economically practical.
Incineration uses controlled combustion to reduce the volume of waste. Some facilities recover energy, while others focus on treatment and disposal. The process produces residual ash that must be managed, and emissions need appropriate controls. The role of incineration in a waste strategy can therefore be considered alongside prevention, reuse, recycling, composting and landfill. Local conditions—including technology, waste composition, regulation, cost, energy systems and public priorities—shape how these options are used.
In environmental systems, material does not disappear when a product becomes waste. Its components move between human and natural systems through collection, processing, emissions, residues and disposal. Each stage can involve flows of energy and matter, and choices made at one point can affect impacts elsewhere. This systems perspective helps explain why waste policies are often assessed across multiple environmental, social and economic considerations.
Human activity and ecosystem structure
Ecological pyramids represent features of trophic structure, such as the number of organisms, biomass or energy present at different feeding levels. Their shape depends on the ecosystem and on the measure used. Producers form the base of many energy and biomass pyramids because they capture energy or build organic matter. Consumers obtain energy and matter through feeding relationships, and decomposers process organic material from across trophic levels.
Human activities can alter ecosystems through changes to habitat, resource availability, mortality, disturbance or the movement of organisms. Examples include land conversion, harvesting, pollution, introduction of non-native species and changes to water flow. Such influences may affect populations and the relationships among organisms, with consequences that extend through food webs. The type and scale of change depend on the activity, the ecosystem and the organisms involved. An ecosystem includes both its living communities and the physical conditions that shape their interactions.
Environmental change can influence different trophic levels directly or indirectly. Changes in primary productivity, habitat structure, the availability of food or the abundance of consumers can alter the relationships represented by an ecological pyramid. The same human activity may have different effects in different ecosystems because species, climate, nutrient availability and food-web connections vary from place to place.
Question (c)
(c) Describe two ways in which the pyramid structure of an ecosystem may be changed by a named human activity. [2]
| Human activity | How pyramid structure is changed |
|---|---|
| 1. | |
| 2. |
Together, these questions place human resource use and ecological relationships within the broad scope of ESS. The recycling figure provides comparative environmental data, while the incineration prompt considers a management option for solid waste. The final prompt concerns changes to trophic structure linked to human activity. The figure, question wording and mark values in this article follow the supplied images.
No Comments