

15 Sep 3 Examiner Ready IB ESS IA Methods: Checklist, Stats, Examples
Choose fieldwork when you’re measuring physical or biological variables directly, like pH, turbidity, or species counts. Choose surveys when your research question involves human attitudes, perceptions, or behavior. Use secondary data when a reliable dataset already exists at a scale your own fieldwork can’t reach. Whatever you pick, your ESS IA methods have to produce a repeatable, ethical process that generates data your chosen statistical test can actually handle.
TL;DR:
- Fieldwork is ideal for measuring physical or biological variables directly, but weather and access can impact the repeatability of data collection.
- Surveys are suitable for studying human attitudes and behaviors, requiring sufficient respondents and careful question wording to avoid bias.
- Use secondary data only if you can manipulate the raw dataset yourself to answer a new research question, not just summarize existing reports.
- Choose your statistical test based on data type: t-tests for normal, continuous data, and Spearman’s rank for ordinal or non-normal data.
- Ensure your method is clear, reproducible, and includes enough replication, calibration logs, and sampling details to withstand examiner scrutiny.
Table of Contents
- Overview of ESS IA Methoden: Fieldwork, Surveys, Lab, and Secondary Data
- Choosing Between Surveys, Fieldwork, Lab Work, and Secondary Data
- Statistical Tools Every ESS IA Should Use Correctly
- Building a Method That’s Actually Repeatable
- Presenting Data: Raw Numbers, Processed Results, and Uncertainty
- Turning Results Into a Defensible Conclusion
- Three ESS IA Method Examples You Can Adapt
- Pre-Data-Collection Checklist
- What an Examiner Actually Looks for in Your Method
- Why Method Rigor Beats a Flashy Topic
- Get Hands-On Help Refining Your ESS IA Method
- Sources
- FAQ
Overview of ESS IA Methoden: Fieldwork, Surveys, Lab, and Secondary Data
Every strong ESS IA method starts with matching the tool to the question, not the other way around. Here’s how the four main options stack up:
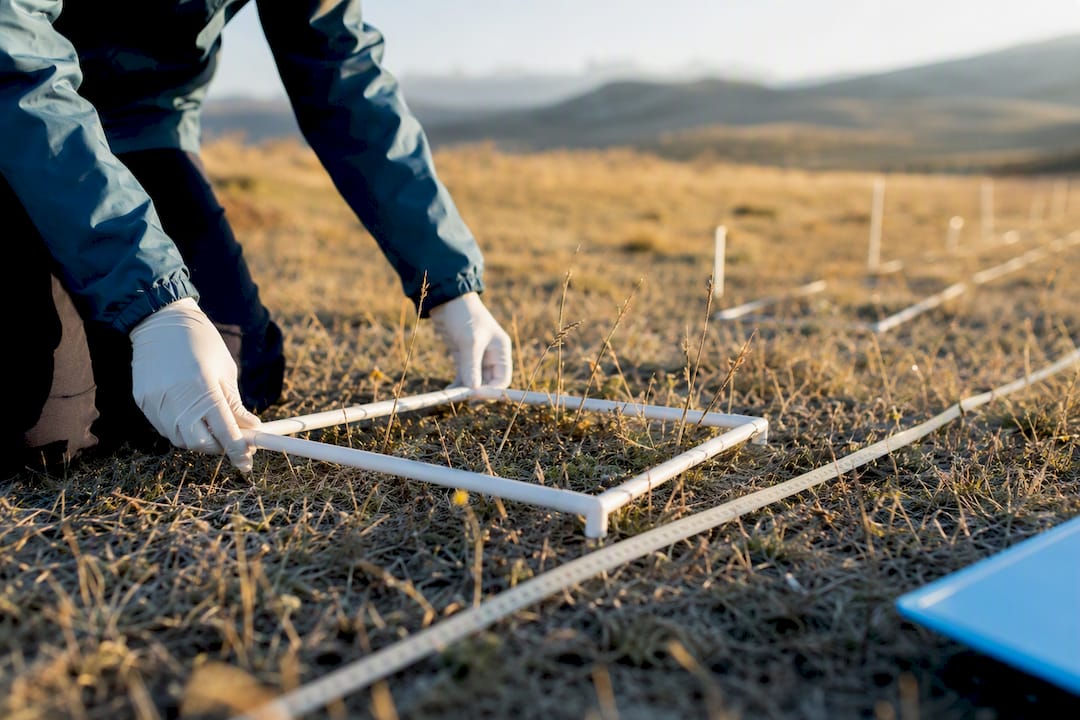
- Fieldwork measures real environmental variables on location, things like dissolved oxygen, canopy cover, or macroinvertebrate diversity. It gives you high ecological validity, but weather, access, and disturbance to habitats can all threaten your repeatability.
- Surveys work when you need attitudes or behaviors, like willingness to pay for conservation. Watch for sampling bias (who actually responds) and question wording that leads respondents toward an answer.
- Lab experiments let you control variables tightly and replicate easily, which suits questions about, say, plant growth under different light conditions. Most school labs can’t replicate a full ecosystem, so keep your claims proportional to what you actually tested.
- Secondary data works when you’re answering a genuinely new question using someone else’s raw numbers. Simply summarizing an existing report isn’t enough. You need to manipulate the data yourself, whether that’s calculating trends, running correlations, or comparing regions the original source didn’t compare.
Choosing Between Surveys, Fieldwork, Lab Work, and Secondary Data
The decision usually comes down to five practical constraints, not personal preference. Walk through them in this order:
- Can you actually measure the variable? If your RQ needs a physical reading (soil moisture, noise levels), fieldwork or lab work wins. If it needs opinions or self-reported behavior, only a survey works.
- Is your sample size realistic? A survey needs enough respondents for meaningful statistics to support valid use of a t-test. Fieldwork sites need enough replication points to justify an average.
- Do you have access and time? A river 20 minutes from school beats a “perfect” wetland three hours away that you can only visit once.
- Are there safety or ethical limits? Working with human subjects triggers consent requirements; certain fieldwork sites need landowner or school permission.
- Which test will your data support? If your data will be ordinal or non-normal, plan for Spearman’s rank from the start rather than discovering it doesn’t fit a t-test later.
Three quick mappings: “How does distance from a road affect lichen diversity?” points to fieldwork. “Do age groups differ in recycling attitudes?” points to a survey. “Has deforestation in a named region changed over the last decade?” points to secondary data from a source like Our World in Data.
Statistical Tools Every ESS IA Should Use Correctly
Picking the right test isn’t a formality. Examiners can tell within a paragraph whether a student understood why they ran a particular test or just copied a formula.
- T-test: use this when comparing the means of two groups of continuous, roughly normal data, for example, plant height in shaded versus sunny plots. Report the mean and standard deviation for each group, the t-value, degrees of freedom, and the p-value.
- Spearman’s rank correlation: use this for ordinal data or when your data doesn’t follow a normal distribution, like ranking sites by pollution level against species diversity rank. Report the correlation coefficient (r_s) and whether it’s statistically significant.
- Descriptive statistics: always report mean, standard deviation, and range before you jump to inferential tests. Choose your graph type based on what you’re showing: scatter plots for relationships, bar charts with standard deviation bars for group comparisons.
Quick Stat Reference: A p-value below 0.05 is conventionally treated as statistically significant, meaning the pattern you observed is unlikely to be due to chance alone. Both the t-test and Spearman’s rank are considered appropriate, well-supported choices for the scale of data most IB students collect.
Building a Method That’s Actually Repeatable
A repeatable method is one another student could follow using only your write-up. That’s the real test examiners apply, whether they say it that way or not.
- State your independent, dependent, and controlled variables in plain sentences: what you’re changing, what you’re measuring, what you’re holding constant.
- Build in replication. A common minimum is three repeats per sampling point or treatment, though your context might call for more.
- Randomize your sampling locations or survey respondents where possible to avoid unconscious bias in site selection.
- Keep a calibration log for any equipment (pH meters, light meters) and note consent procedures if working with people, alongside any environmental safeguards you followed.
Pro Tip: Run a pilot test with a handful of data points before your main collection. It catches equipment problems, unclear survey questions, and unrealistic time estimates before they cost you real data. This kind of upfront testing is exactly what reproducible method design guides recommend for lab and field investigations alike.
Presenting Data: Raw Numbers, Processed Results, and Uncertainty
Your raw data table should show every individual measurement exactly as collected, with units and appropriate decimal places, nothing averaged yet. Your processed data section is where the calculation happens: means, standard deviations, and any derived values like ratios or percentage change.
- Use scatter plots when showing a relationship between two continuous variables, especially before running Spearman’s rank.
- Use bar charts with standard deviation bars when comparing group means, which pairs naturally with a t-test.
- Use boxplots when you want to show spread and outliers without assuming a normal distribution.
- Line graphs suit data collected over time, like temperature readings across a day.
Address uncertainty directly. State the precision of your measuring equipment (a thermometer accurate to ±0.5°C, for instance) and flag any outliers you excluded, explaining why.
Turning Results Into a Defensible Conclusion
Analysis paragraphs should link each pattern in your data back to an environmental concept and, ultimately, back to your research question. Don’t just describe the graph. Explain what it means ecologically or socially.
- A strong conclusion answers the RQ directly in the first sentence, then supports it with your strongest statistical evidence.
- Avoid overclaiming. If your t-test showed significance for one site, don’t imply it applies to the whole ecosystem type.
- Structure your evaluation as three steps: name a specific limitation, assess how it likely affected your results (not just that it existed), then propose a concrete, feasible improvement.
- Weak evaluations list limitations without judging their impact. Strong ones say something like “the small sample size (n=8) likely widened the confidence interval, so a larger dataset would strengthen confidence in the correlation.”
Three ESS IA Method Examples You Can Adapt
- Fieldwork exemplar. RQ: “How does distance from a footpath affect ground vegetation cover in a local woodland?” Sample at five points along transects at set distances from the path, with three replicates per point. Recommended analysis: Spearman’s rank correlation between distance and percentage cover.
- Survey exemplar. RQ: “Do different age groups in a local community differ in their attitudes toward single-use plastic bans?” Target a sufficient number of respondents split across defined age brackets, using a Likert-scale questionnaire piloted on a few people first. Analyze with a t-test or chi-square depending on how you structure the response categories.
- Secondary/lab hybrid exemplar. RQ: “How has forest cover changed in a named country over the past 20 years, and does it correlate with reported CO2 emissions?” Pull time-series data from World Bank Data, process it into matched annual pairs, then run Spearman’s rank between the two variables.
Browsing past ESS IA examples before you finalize your own method can reveal how other students structured similar comparisons.
Pre-Data-Collection Checklist
- Confirm permissions (site access, school approval, participant consent) before you show up to collect anything.
- Run a small pilot to catch equipment or wording issues.
- Calibrate instruments and log the readings.
- Set your data-recording format (spreadsheet columns, units) in advance so you’re not improvising in the field.
- Keep dated notes and photos as documentation your teacher can authenticate later.
Skipping the pilot is the single most common way students lose time. A quick trial run almost always saves more hours than it costs.
What an Examiner Actually Looks for in Your Method
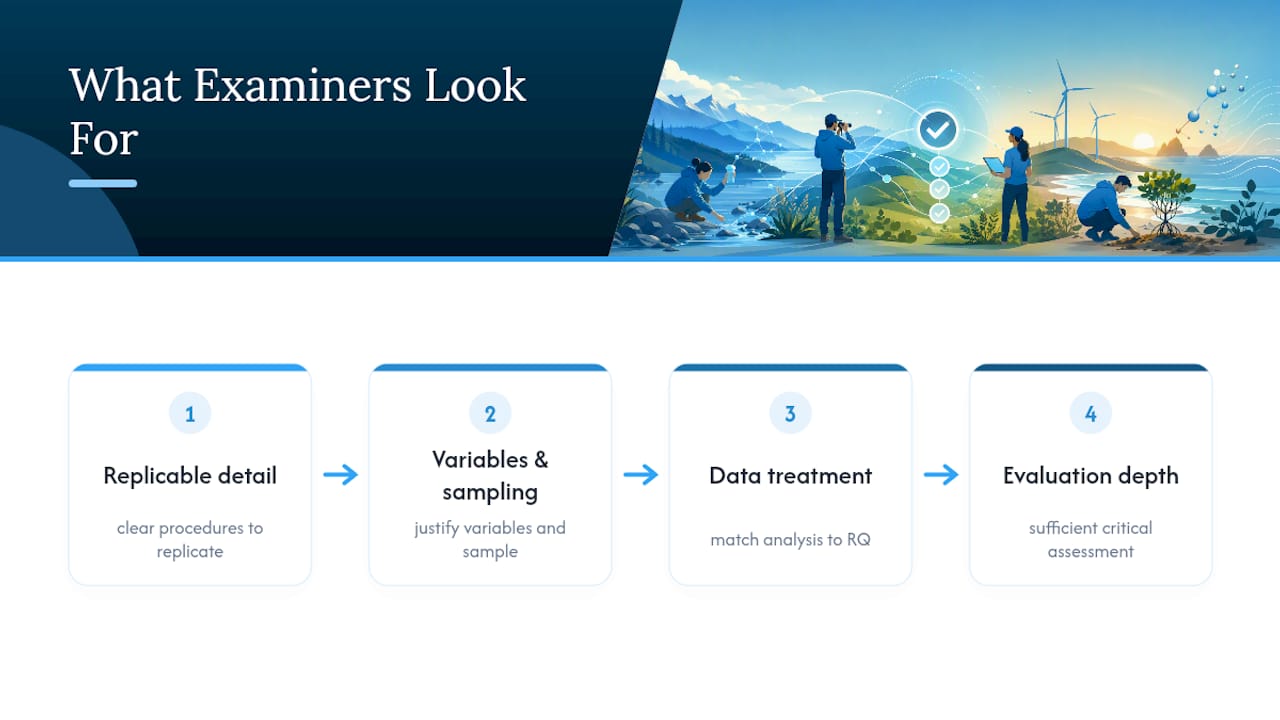
Examiners weigh whether your method is detailed enough for someone else to replicate it, and whether your data treatment matches the sophistication your RQ demands. A common piece of feedback: “sampling method described but not justified.” The fix is usually one added sentence explaining why you chose that sample size or location.
Tutoring sessions focused on IA methodology tend to target exactly this gap, translating vague rubric language into specific rewrites for variables, sampling justification, and evaluation depth, the kind of targeted feedback that’s hard to get from a checklist alone.
Why Method Rigor Beats a Flashy Topic
Students often chase an impressive-sounding RQ and neglect the method that has to support it. A narrow, well-executed investigation with a repeatable design and honest evaluation consistently outperforms an ambitious topic with shaky data collection. Draft early, check your method against the criteria more than once, and let the evaluation section do real analytical work.
— Marija
Get Hands-On Help Refining Your ESS IA Method
Some tutoring services provide direct, one-on-one feedback from tutors experienced with IB examiner standards, applied specifically to your method section. Instead of guessing whether your sampling strategy will satisfy Criterion C, you get it reviewed before you submit, along with coaching on which statistical test fits your data and how to write an evaluation that actually assesses your limitations rather than just listing them.
Sessions typically cover method review, statistical test selection, and evaluation drafting, the three areas where IA marks are won or lost. If you’re also curious how a tutor’s honest academic-writing support compares with AI drafting tools, resources like AmmarAI are worth a look for context, though nothing replaces a tutor who can catch a flawed sampling strategy before it costs you marks. Ready to get your method checked? Book a session with an IB ESS tutor and start your IA with a method that’s already examiner-tested.
Sources
Start with the official IB subject guide for ESS to check exact criterion wording before you write your method section. For step-by-step help structuring reproducible methods and data tables, LabWrite offers practical templates. If your IA relies on secondary data, Our World in Data and the World Bank’s open datasets are reliable, citable repositories.
FAQ
What is the best method for an ESS IA?
There’s no single best method. It depends on your RQ: fieldwork suits directly measurable environmental variables, surveys suit human attitudes, and secondary data suits large-scale questions your own data collection can’t reach.
Should I use a t-test or Spearman’s rank for my ESS IA?
Use a t-test when comparing means of two groups with roughly normal, continuous data. Use Spearman’s rank when your data is ordinal or doesn’t follow a normal distribution.
How many data points do I need for my ESS IA?
There’s no fixed universal number, but most investigations aim for a minimum of three replicates per fieldwork point and enough respondents for meaningful statistics in a survey.
Can I use secondary data for my ESS IA?
Yes, as long as you manipulate the raw data yourself to answer a genuinely new research question rather than summarizing an existing report’s conclusions.
How do I make my ESS IA method repeatable?
State your variables clearly, build in replication, calibrate your equipment, and describe your sampling process in enough detail that another student could follow it exactly. A tutor experienced with IB rubrics, like those at Esstutor, can review your draft against Criterion C specifically.
No Comments