


18 Aug ESS IA Structure: Research Question, Criteria and Report Planning
The ESS IA for first assessment 2026 is an individual investigation report with a 3,000-word maximum, assessed against six criteria totalling 30 marks. A clear structure can help the reader follow the evidence, but no heading sequence solves a fixed share of the assessment.
Before you write a single paragraph, run through this:
- Word limit: Maximum 3,000 words. Check the current guide’s detailed inclusions and exclusions; do not assume every caption or table is automatically exempt, or move explanatory prose into them to avoid counting it.
- Six criteria: A, research question and inquiry; B, strategy; C, method; D, treatment of data; E, analysis and conclusion; F, evaluation. Use the official descriptors rather than a substitute list of section titles.
- Core deliverables: a testable research question, a repeatable method, clean data presentation, and an evaluation that names real limitations. Raw data sheets and long survey forms move to appendices.
The criteria aren’t a formality checked at the end. They’re the tool examiners use line by line, so they should shape every sentence you write, not just the final proofread.
Key Takeaways
Your ESS IA score depends less on your topic and more on whether every section visibly answers the assessment criteria that grade it.
| Point | Details |
|---|---|
| Narrow your RQ first | A single measurable variable and a specific location beats a broad theme every time. |
| Build repeatability into the method | Equipment precision, replicate counts, and sampling design must be specific enough to repeat. |
| Match figures to data type | Line graphs for trends, bar charts for categories, scatterplots for relationships. |
| Name real limitations in the evaluation | Specific, quantified uncertainty scores higher than vague disclaimers. |
| Use the criteria as a live checklist | Check every draft against Criteria A through F, not just the final version. |
| Get targeted feedback when stuck | Esstutor’s ESS-focused tutoring reviews your RQ, method, or draft against the actual rubric. |
Table of Contents
- What Are the Six ESS IA Assessment Criteria?
- How Should You Structure the ESS IA Report?
- How Do You Write a Strong ESS Research Question?
- What Should Your Method Section Include?
- How Do You Present ESS IA Results Effectively?
- How Do You Write the Analysis and Evaluation Sections?
- Where Can You Find Strong ESS IA Exemplars?
- What’s a Realistic Timeline for Completing the ESS IA?
- What Do Examiners Say Costs Students the Most Marks?
- An Examiner’s View on What Actually Moves the Needle
- How Esstutor Can Help You Strengthen Your ESS IA
- Where to Go for Official ESS IA Guidance
- Sources
What Are the Six ESS IA Assessment Criteria?
The criteria address research question and inquiry, strategy, method, treatment of data, analysis and conclusion, and evaluation. They are assessed using the descriptors, not by awarding automatic marks for including prescribed headings or keywords.
A few practical ways to push each criterion toward the top band:
- For Criterion A, narrow your RQ to one measurable variable in one specific location, not a broad theme like “deforestation’s effects.”
- For Criterion B, explain an environmental strategy relevant to the issue and tensions between perspectives on it. You do not necessarily have to test the policy itself experimentally.
- For Criterion C, write your method so a classmate could repeat it tomorrow without asking you a single question.
- For Criterion D, choose the graph type that matches your data type, not the one that looks nicest.
- For Criterion E, open with the single trend that answers your RQ before explaining anything else.
- For Criterion F, evaluate specific methodological limitations, improvements that address them and unresolved questions arising from the investigation. A fixed count of two weaknesses is not the descriptor.
Make methods reproducible with relevant sampling locations, instruments, timing and procedures. The detail needed depends on the investigation; exact GPS coordinates or equipment model numbers are not a universal formula separating particular marks.
How Should You Structure the ESS IA Report?
There’s no single mandated template from the IB, but a scaffold like the one below reliably maps content to what each criterion is looking for, and it keeps you from burning your 3,000 words in the wrong places.
Everything that justifies a claim in your analysis needs to sit in the main text. Everything that just supports it, like your full raw dataset or a blank copy of your survey, belongs in an appendix instead.
A few formatting notes worth locking in before you start drafting:
- Put your candidate number and a running word count on the cover page, not your name.
- Pick one citation style (APA is common for ESS) and use it consistently in the bibliography.
- Adapt generic headings like “Method” into specific ones like “Measuring Dissolved Oxygen Along the River Transect” — specificity signals focus to an examiner from the first page.
How Do You Write a Strong ESS Research Question?
A focused research question identifies what will be investigated and the relevant context. Experimental, observational and secondary-data studies can require different wording; not every question must include a manipulated independent variable and a field location.
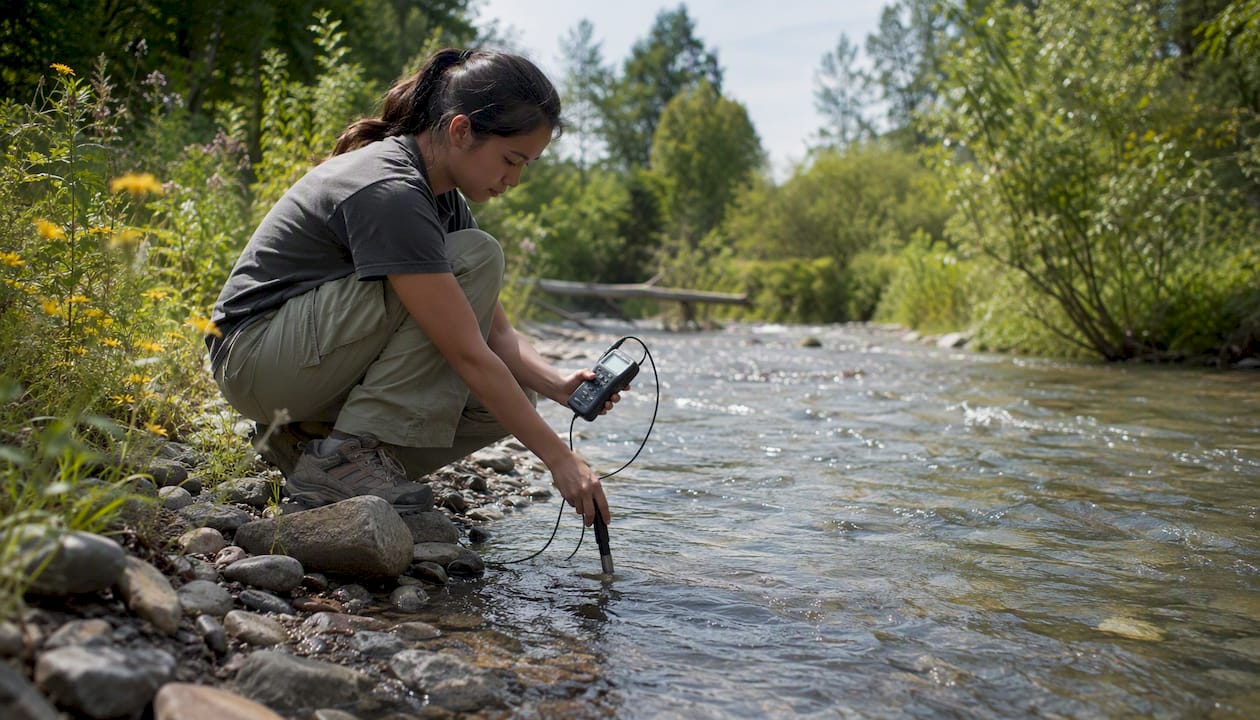
Compare these two:
Weak: “How does pollution affect river health?”
This has no defined location, no measurable variable, and no clear method implied. An examiner can’t tell what you’d even measure.
Illustrative observational question: “What is the relationship between distance from [a documented outflow] and dissolved oxygen concentration at sampled sites along [river] during [period]?” Verify the actual site and consider temperature, flow and other confounders before interpreting an association as an effect.
Your rationale, the paragraph that follows your RQ, should explain why the chosen location is relevant, identify any related environmental value system or strategy, demonstrate feasibility within your constraints, and briefly connect to relevant background theory or policy.
A tight, thesis-driven opening structure built around one clear focus keeps this section from sprawling into unrelated context.
What Should Your Method Section Include?
Your method needs to answer five things clearly enough that a stranger could repeat your investigation: where you sampled, how you chose your sample sites, what variables you measured, what equipment you used, and how you controlled for repeatability. Missing any one of these is the fastest way to lose Criterion C marks.
A workable sampling checklist looks like this:
- State the sampling method by name (stratified, random, systematic transect) and justify why it fits your RQ.
- List every variable measured, with units, and note which are controlled vs. dependent.
- Name the exact equipment (model numbers help) and state its precision or margin of error.
- Note how many replicates you took at each point and why that number was chosen.
- Describe how you recorded raw data, ideally with a sample data-sheet layout reproduced in an appendix.
Safety and ethics deserve a real paragraph, not a throwaway line. If you surveyed people, note how you obtained informed consent. If you were in the field, note the environmental safety steps you took (site permissions, weather checks, protective equipment for water or soil sampling).
Record the instrument’s stated accuracy, display resolution and calibration separately where relevant. Use your actual records rather than copying a template’s numerical uncertainty. Repeated readings can vary because conditions change as well as because of measurement error.
How Do You Present ESS IA Results Effectively?
Choose a graph for the question and variables. A scatter plot can show measurements along a continuous gradient; connect points only when that connection has meaning, such as a time sequence. Consider dot plots or boxplots for group distributions rather than assuming every result needs a mean bar chart.
Use informative captions such as “Figure [number]: [variable and units] at [sites] during [period]; n = [independent units]. Bars show [defined measure], where relevant.” Use your actual values and distinguish independent samples from repeated instrument readings.
A few rules worth keeping visible while you build tables and graphs:
- Always label axes with units, and always state your sample size somewhere on or near the figure.
- Where useful, show spread or uncertainty and define the measure, or show individual observations. Repeated readings do not require error bars on every graph, and are not automatically independent samples.
- Choose summaries suited to the data. Means and standard deviations can be useful, but medians, ranges, counts or proportions may be more appropriate for other datasets. There is no requirement to calculate a mean and SD for every variable.
- If you calculate a correlation coefficient, state what it actually shows and don’t imply causation from it.
- Never claim statistical significance unless you’ve run and reported an actual significance test. Overclaiming from a small ESS dataset is one of the more common ways students undercut their own Criterion D score.
How Do You Write the Analysis and Evaluation Sections?
Open your analysis with the single trend that directly answers your RQ, stated in one clear sentence, before you explain anything else. Examiners want the headline finding up front, not buried three paragraphs into a discussion of general context.
From there, work outward: explain why that trend likely occurred, using your background research and the environmental science behind it, then connect it back to the strategy or tension you introduced in Criterion B. A tight, thesis-first structure keeps this section from drifting into restating your results instead of interpreting them.
Your evaluation needs specific, honest limitations, not generic disclaimers. Run through this checklist:
- Sampling bias — was your sample size or site selection likely to skew results in a particular direction?
- Instrument error — what was the precision limit of your equipment, and did it matter for your conclusions?
- Confounding variables — what else could have caused the pattern you observed besides your independent variable?
- Reliability — would repeating the study on a different day or season likely give the same result?
- Validity — did your method actually measure what your RQ claims to be investigating?
Match improvements to the actual limitations. More sites, repeated seasons, improved identification or a better instrument address different problems; choose what would help and explain remaining constraints. Extending a study across seasons is not the automatic remedy for every small sample.
Where Can You Find Strong ESS IA Exemplars?
A useful illustrative caption identifies the measured variable, relevant units, sample size and period. Replace every placeholder with your actual records, and explain the scientific significance in the analysis. A caption alone does not establish a mark.
Use examples to understand approaches to questions, data and evaluation, and check which syllabus they follow. An example on a tutoring site should not be assumed to be an authenticated student submission with a verified mark unless it is explicitly documented as such.
Use exemplars to understand expectations and check which syllabus they follow. Do not copy another student’s prose, analysis or data. A broadly similar topic is not automatically misconduct; your evidence use, decisions and submitted interpretation must meet the school’s authenticity requirements.
What’s a Realistic Timeline for Completing the ESS IA?
The guide allocates 10 hours to the investigation. Use your school’s schedule for planning, evidence collection and permitted draft feedback; a longer calendar is not itself evidence of a stronger report. The milestone sequence below is an example rather than a universal deadline plan.
- Topic and RQ selection (1 to 2 weeks): Brainstorm, narrow to one testable variable, confirm feasibility with available equipment.
- Teacher consultation (a single session): Get verbal feedback on your draft RQ and rationale before committing to a method.
- Method development (1 week): Design your sampling protocol, source equipment, and plan your data sheet.
- Data collection / fieldwork (1 to 2 weeks, weather-dependent): Carry out sampling, log uncertainties as you go.
- First draft (1 to 2 weeks): Write results, analysis, and evaluation while the fieldwork is still fresh.
- Teacher feedback on one draft (1 session): This is your only permitted round of written comments.
- Final revision and submission (3 to 5 days): Incorporate feedback, finalize formatting, confirm word count.
Teachers can guide you verbally at every stage above and give written comments only at step 6, so use that single written round strategically. Don’t submit a rough first attempt hoping for a full rewrite; submit your strongest possible draft so the feedback can sharpen details instead of fixing structural gaps.
Final submission checklist: word count confirmed under 3,000, all figures captioned with units and sample sizes, references formatted consistently, appendices labeled and referenced in-text, candidate number on the cover page.
What Do Examiners Say Costs Students the Most Marks?
Examiner-facing guidance keeps repeating the same handful of tips, and they’re worth treating as a live checklist you return to at every draft, not just at submission:
- Print the six criteria and check your draft against them section by section, not just once at the end.
- Show repeatability explicitly in your method; don’t assume it’s implied by describing what you did.
- State uncertainty and error clearly rather than hiding it, since acknowledging limits scores better than pretending they don’t exist.
- Match your statistical claims to what your sample size actually supports.
Two patterns show up constantly in reports that underperform. The first is a results section with too little raw data to support the conclusion drawn from it, an examiner has no way to verify a claimed trend if only three data points support it. The second is a method section missing key details, like equipment precision or replicate count, that later shows up as unexplained variation in the results with no acknowledgment in the evaluation.
The single biggest gap between a mid-band and top-band ESS IA usually isn’t the topic or the data quality. It’s whether the student used the assessment criteria as an active drafting tool throughout the process, or only skimmed them once before writing the final paragraph.
Use the criteria the same way examiners do: as a running scorecard you check against after every section, not a rubric you glance at once and forget.
An Examiner’s View on What Actually Moves the Needle
Use your evaluation to explain specific limitations, their effects on the evidence and feasible improvements. The quality of the reasoning matters more than the number of generic weaknesses listed. Review your discussion against the current assessment descriptors; no single section structure guarantees a score.

Describe the uncertainty supported by your observations and instrument information, then explain its relevance to the conclusion. A numerical uncertainty is useful when justified, but inventing one does not improve an evaluation.
Students consistently underestimate how much this single habit affects the evaluation score. It costs nothing extra to log it in the field and it strengthens your mark rather than weakening it, which is the opposite of what most students assume before they try it.
If you’re stuck at the planning stage or need someone to sanity-check a method before you commit hours of fieldwork to it, that’s exactly the kind of targeted session worth booking early rather than after a draft has already gone sideways.
How Esstutor Can Help You Strengthen Your ESS IA
Marija Maletz has 13 years of teaching experience and more than 10 years as an IB ESS examiner. Tutoring can help you understand concepts and choices in your own investigation. The school remains responsible for approval and authentication; assessed analysis and writing remain yours.
A single focused session typically gets you:
- A research question refined to one measurable variable and a feasible location.
- A method checked for the repeatability and safety details Criterion C rewards.
- Help interpreting your data and building an analysis that ties directly back to your RQ.
- Annotated feedback on a draft, flagged against the actual assessment criteria rather than general writing advice.
If you want that kind of targeted support before your next teacher feedback round, Esstutor’s IB ESS internal assessment coaching page is the place to start, and booking a session now leaves you enough runway to act on the feedback before your deadline closes in.
Where to Go for Official ESS IA Guidance
- Official ESS subject guidance and criteria breakdowns: start with a detailed IA guide covering the RQ, criteria, and examples for the full markband descriptors.
- Teacher-support rules: review what teachers can and can’t do at each stage so you know exactly what feedback to expect.
- Exemplar collections: study Esstutor’s ESS IA examples and topic ideas from a bank of environmental issue examples to see criteria applied to real topics.
- Open datasets for secondary research: Our World in Data and World Bank indicators both offer citable, cleaned datasets when primary data collection is limited by access or time.
- Local climate data: climate-data.org is useful for location-specific climate normals when your RQ depends on regional weather patterns.
Always cite open datasets with the organization name, dataset title, and access date, and check any reuse license before pulling a chart or figure directly into your appendices.
Sources
Anything needed to justify a result or a claim in your analysis stays in the main text. Anything that just supports or documents that claim, without which the argument still stands, moves to an appendix. Raw data tables, full survey instruments, and calibration logs are the classic appendix candidates; a summary table of means goes in the main text.
Citing a dataset or a website follows the same logic as citing a book: author or organization, year, title, and URL. For example, a dataset drawn from a resource like Our World in Data would be cited with the organization name, the dataset title, and the access date, exactly as you’d cite a printed source. If you reuse a chart or dataset under an open license, check what that license actually permits before you paste it into your report. Some open licenses require attribution only; others restrict commercial or modified use.
On academic honesty: teachers can give verbal feedback at any stage of your IA, and one round of written comments on a single draft is permitted. What they can’t do is write your research question, edit your prose, or tell you what your conclusion should say. Every school also runs its own internal authentication process to confirm the work is genuinely yours, so confirm your school’s specific deadlines and sign-off steps early rather than assuming they match a generic template.
- IB ESS IA Guide (2026) | Research Questions, Criteria & Examples – Science Sauce
- Teaching the IB ESS IA | Teacher Guide, Resources & Marking Advice – Science Sauce
- Essay Aufbau: Struktur eines guten Essays
- Ourworldindata
No Comments