

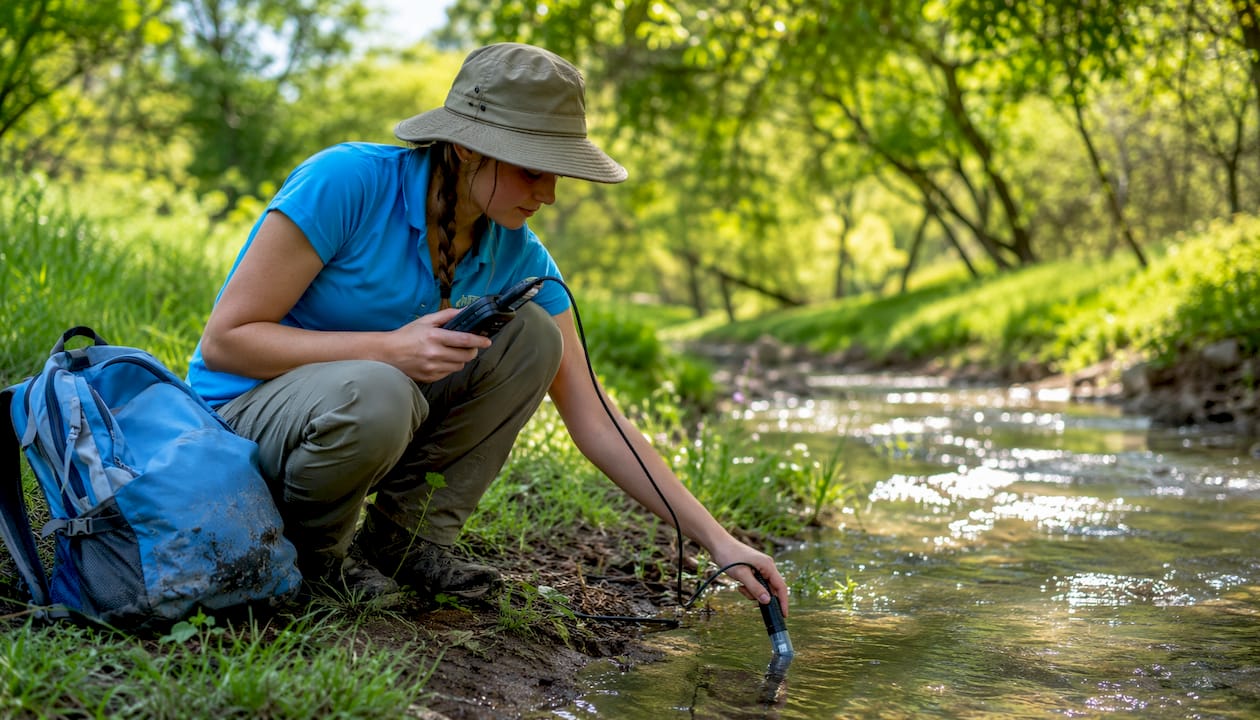
27 Jul Baseline Study in IB ESS: A Student Guide
A baseline study in IB ESS measures existing physical, biological, and socio-economic conditions at a site before any development or intervention takes place, creating the reference point against which future change is measured. Without that starting snapshot, you simply cannot prove that a project caused any change at all. For your IB ESS internal assessment, a well-designed baseline is what turns your data into evidence and your conclusions into reasoned recommendations.
Table of Contents
- What does a baseline study actually measure?
- Why are baseline studies required in EIA and IB ESS?
- How do you design a baseline study for an IB ESS IA?
- How much baseline data is enough for an IB IA?
- What field methods and US data sources can students use?
- How do you analyze baseline data to detect impacts?
- How do you report a baseline study for IB IA criteria?
- Mini example: student baseline for a school sports-pitch expansion
- Key Takeaways
- What I tell every student before they start a baseline
- Esstutor can help you plan your IB ESS baseline
- Useful sources and further reading
What does a baseline study actually measure?
Every indicator you choose must connect directly to your project’s logic chain — the “if we do X, then Y will change” reasoning that drives your IA. Ecological indicators fall into three main groups:
Physical indicators
- Water quality parameters: pH, dissolved oxygen, turbidity, nitrate concentration
- Soil properties: compaction, organic matter content, erosion rate
- Air quality: particulate matter, CO₂ concentration near traffic corridors
Biological indicators
- Species richness and diversity indices (Simpson’s, Shannon)
- Percentage vegetation cover measured by quadrat
- Habitat type and extent mapped by transect
Socio-economic indicators
- Population density and land-use classification
- Proximity to sensitive receptors (schools, water bodies)
- Waste generation rates or energy consumption data
Measured variables typically include habitat types, species diversity, air and water quality, soil fertility, and human population density.
Pro Tip: Pick indicators you can actually measure with the equipment your school has. A dissolved oxygen meter and a quadrat frame will take you further than an ambitious plan that requires lab analysis you cannot access.
Why are baseline studies required in EIA and IB ESS?
The primary purpose of a baseline study is to allow measurement of project impact by establishing initial levels of key environmental indicators. Without pre-project data, it is impossible to quantitatively measure the effectiveness of mitigation or restoration strategies.
Beyond impact detection, baselines serve several other functions that matter for your IA score. They help set realistic targets, support stakeholder engagement, and define the scope of the problem you are investigating. Properly designed baseline data also feed mathematical risk estimation models, providing the inputs needed for ecological risk assessment at a site-specific level.
For IB ESS specifically, your examiner will look for evidence that your data are comparable across time, that your methods are replicable, and that your conclusions follow logically from what you measured. A baseline makes all three possible.
How do you design a baseline study for an IB ESS IA?
Conduct your baseline only after your results chain and monitoring plan are final. Collecting data before you know which indicators matter wastes time and weakens your IA.
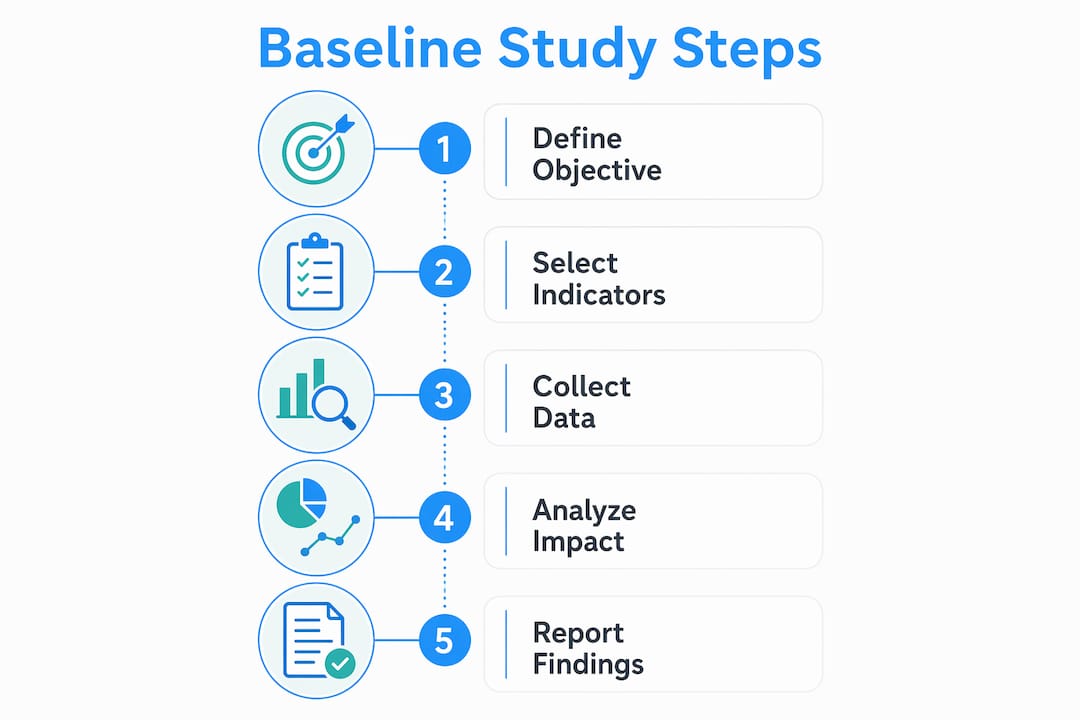
- Define scope and objective. Write one sentence stating what change you expect and what you will measure to detect it.
- Choose indicators. Select physical, biological, or socio-economic variables that map directly to your IA hypothesis.
- Finalize methods. Match each indicator to a measurable, replicable field method your school can support.
- Design your sampling. Decide between random, systematic, or stratified sampling; set the number of replicates; account for seasonality.
- Pilot and adjust. Run a short trial to check your equipment, refine your protocol, and estimate natural variability.
- Collect baseline data. Record everything: date, time, weather, equipment calibration, and any anomalies.
Sampling design checklist:
- Random sampling: use a random-number grid to place quadrats or sampling points
- Stratified sampling: divide the site into zones (e.g., shaded vs. open) and sample each proportionally
- Replicates: aim for at least 5–10 per zone for simple descriptive statistics
- Timing: collect data across at least two time points to capture natural variation before the intervention
Pro Tip: As an IB examiner, the single most common reason students lose marks on methods is vague justification. Write exactly why you chose each method, not just what you did. “I used a 0.5 m² quadrat because it matched the scale of the vegetation patches” scores better than “I used a quadrat.”
How much baseline data is enough for an IB IA?
BetterEvaluation recommends scaling baselines to project needs: not every project requires an exhaustive, expensive baseline. The framework uses three levels:
| Project scale | Baseline level | Suggested sampling | Frequency |
|---|---|---|---|
| Small school IA (one site, one indicator) | Light | Several sample points, one indicator group | Once pre-intervention |
| Larger community IA (multiple zones) | Moderate | Multiple sample points, two indicator groups | Twice pre-intervention |
| Greenfield development (EIA context) | Heavy | Systematic grid, all three indicator groups | Over multiple months or years |
For most IB IAs, a “light” baseline is appropriate and credible. The Australian water-quality guidelines note that up to three years of biological monitoring may be ideal for robust reference conditions, but shorter designs are valid when matched to the specific pressure being studied.
Pro Tip: Run a pilot session first. Measure variance across five points before committing to your full sample size. If variance is low, you need fewer replicates. If it is high, add more before your official baseline collection.
What field methods and US data sources can students use?
Good baselines combine primary field data with secondary sources. Reviewing existing data before primary collection avoids duplication and saves time. Use primary collection only when secondary sources are outdated or do not match your indicators.

| Source | What it provides | How to use it in your IA |
|---|---|---|
| USGS | Streamflow, water chemistry, sediment data | Background water-quality baseline for watershed studies |
| EPA | Air quality standards, water quality benchmarks, contamination data | Compare your field readings to regulatory thresholds |
| NOAA | Climate normals, precipitation, temperature records | Contextualize seasonal variation in your baseline |
| iNaturalist | Georeferenced species observations | Cross-check species lists and habitat assessments |
| State environmental agencies | Local land-use maps, pollution records | Site-specific secondary data for socio-economic indicators |
Student fieldwork equipment checklist:
- Dissolved oxygen and pH meter (or test strips for lower cost)
- Quadrat frame (0.25 m² or 0.5 m²) and transect tape
- Soil compaction meter or penetrometer
- Smartphone with iNaturalist app for species identification
- Waterproof field notebook and calibration log
How do you analyze baseline data to detect impacts?
Simple descriptive statistics and clear visual plots can reveal meaningful change. You do not need advanced software. A well-designed baseline defines starting conditions precisely enough that even a basic before/after comparison becomes informative.
Plots to produce:
- Time-series line graph: shows how an indicator changes from baseline through post-intervention
- Before/after bar chart: compares mean values at baseline and endline with error bars
- Boxplot: displays spread and median, useful for showing variability across sample points
Simple stats students can apply:
- Mean and median: describe central tendency for each indicator
- Standard deviation: quantify natural variability in your baseline
- Percent change: calculate how much an indicator shifted from baseline to endline
- Student’s t-test or Mann-Whitney U: test whether the change is statistically meaningful
Pro Tip: Always state your limitations explicitly. If you only sampled on two days, say so. Examiners reward honest evaluation of uncertainty far more than overclaiming. “Results suggest a trend but a larger sample would be needed to confirm significance” is a strong IA sentence.
How do you report a baseline study for IB IA criteria?
A clear, reproducible methods section and raw-data appendices are non-negotiable for IA marks. Your examiner must be able to follow exactly what you did and why.
Report structure:
- Title and aim/hypothesis
- Background and context (literature review, secondary data)
- Indicators and logic chain
- Methods and equipment
- Sampling design and justification
- Results (tables, graphs, maps)
- Analysis and interpretation
- Discussion and evaluation
- Conclusions and recommendations
- Limitations
- Appendices: raw data, calibration logs, questionnaires, permissions
Mapping to IB IA criteria:
| Report section | IB IA criterion |
|---|---|
| Methods and sampling design | Personal engagement, methodology |
| Results and analysis | Results, analysis |
| Discussion and evaluation | Evaluation |
| Conclusions and recommendations | Conclusion |
| Limitations | Evaluation |
Ethical checklist for fieldwork:
- Obtain land-access permission in writing before visiting any private or protected site
- Avoid disturbing nesting birds, protected plant species, or sensitive habitats
- Follow your school’s health and safety protocols for outdoor fieldwork
- Record all permissions and safety briefings in your appendix
Mini example: student baseline for a school sports-pitch expansion
Project objective: Measure pre-expansion soil compaction, percentage vegetation cover, and surface runoff indicators at a school sports pitch to establish a baseline before construction begins.
Sample schedule:
| Sample point | Indicator | Method | Date |
|---|---|---|---|
| Corner A (undisturbed turf) | Soil compaction | Penetrometer, 5 readings | Week 1 |
| Corner A | Vegetation cover | 0.5 m² quadrat, % cover | Week 1 |
| Corner B (high-traffic zone) | Soil compaction | Penetrometer, 5 readings | Week 1 |
| Corner B | Vegetation cover | 0.5 m² quadrat, % cover | Week 1 |
| Drainage outlet | Surface runoff turbidity | Turbidity meter after 10 mm rain | Week 2 |
Timeline: Two weeks of pre-construction sampling, with a second baseline round in Week 3 to capture variability. Post-construction sampling repeats the same protocol at 4 and 12 weeks after groundwork ends.
How this feeds the IA: Baseline compaction and cover values become the reference point. If post-construction readings show significantly higher compaction and lower cover near the construction zone, your data support a conclusion that the expansion caused measurable environmental change — and your recommendations (revegetation, drainage management) follow directly from the evidence.
If a true pre-project baseline is not possible, reconstructed baselines using historical aerial photos, school maintenance records, or stakeholder recall can substitute, though with acknowledged limitations for attribution.
Key Takeaways
A baseline study in IB ESS is the pre-project measurement of physical, biological, and socio-economic indicators that makes impact detection and IA evidence possible.
| Point | Details |
|---|---|
| Definition and timing | Measure existing conditions before any intervention; collect data only after indicators and monitoring plan are finalized. |
| Proportionality | Match baseline effort to project scale: a light baseline suits most IB IAs; heavy baselines are for large EIA contexts. |
| Indicator selection | Choose indicators that map to your IA logic chain and that you can measure with available equipment. |
| Analysis and reporting | Use descriptive stats, before/after plots, and a reproducible methods section to satisfy IB IA criteria. |
| Esstutor support | Esstutor provides one-to-one IA planning, fieldwork method coaching, and mock marking to help you build a credible baseline. |
What I tell every student before they start a baseline
Most students I work with come to baseline planning with the same instinct: collect as much data as possible and figure out what matters later. That approach almost always backfires. You end up with data that does not connect to your hypothesis, methods you cannot justify, and an analysis section that wanders.
The fix is simple but requires discipline. Lock down your logic chain first. Write one sentence that says what you expect to change and why. Every indicator, every sampling point, every method should trace back to that sentence. If it does not, cut it.
The other mistake I see regularly is treating the baseline as a one-off task. Seasonality matters. A soil compaction reading in dry July and a vegetation cover reading after autumn rain are not directly comparable. Even for a light IB IA baseline, two sampling rounds separated by a week or two give you a much stronger foundation than a single visit.
Documentation is where marks are quietly lost. Calibration logs, weather notes, equipment serial numbers, and a clear record of who collected what and when: these details look minor but they are what make your methods section replicable. Replicability is what earns you marks on methodology.
Esstutor can help you plan your IB ESS baseline
Knowing what a baseline study requires and actually building one that satisfies your examiner are two different things. Esstutor offers one-to-one sessions specifically designed to help you move from concept to fieldwork to a polished IA submission.
Working with an experienced IB examiner means your baseline design gets reviewed before you collect a single data point, not after. Sessions cover IA planning and indicator selection, fieldwork method coaching, data analysis and visualization, and mock IA marking with written feedback. You get direct, honest input on whether your sampling design is strong enough and exactly what to fix if it is not.
Book a trial IA tutoring session and start your baseline on solid ground.
Useful sources and further reading
Use these sources directly in your IA bibliography or as background reading when designing your baseline.
| Source | What it offers | How to use it |
|---|---|---|
| USGS Environmental Baseline Study | Real-world watershed baseline methodology | Model your sampling design and water-quality parameters |
| BetterEvaluation — Baseline Basics | No/light/heavy baseline framework | Choose the right level of effort for your IA scale |
| IFRC — Baseline Basics Guide | Sequencing, reconstructed baselines, logic chain | Understand timing and what to do without pre-project data |
| TMEA — How to Plan a Baseline | Step-by-step planning, secondary data review | Follow the planning checklist for your IA design |
| EPA (epa.gov) | Water and air quality standards, contamination benchmarks | Compare field readings to US regulatory thresholds |
| NOAA (noaa.gov) | Climate normals, precipitation records | Contextualize seasonal variation in your data |
| iNaturalist (inaturalist.org) | Georeferenced species observations | Cross-check species lists and habitat assessments |
| Esstutor — ESS Fieldwork Method Guide | IB-specific sampling protocols and equipment lists | Plan and document your field methods for IA submission |
| Esstutor — ESS Data Sources | Directory of secondary datasets for IB ESS IAs | Find and cite secondary data to supplement your baseline |
Remember: record full citation details for every source you use, including the URL, access date, and author or organization name. Your IA bibliography must be complete and consistent.
No Comments