


08 Jun Explain Ecological Footprint: A Clear 2026 Guide
TL;DR:
- The ecological footprint measures human demand on Earth’s land and sea areas needed for consumption and waste absorption. When this demand surpasses available biocapacity, ecological overshoot occurs, indicating unsustainable resource use. Comparing national footprints to biocapacity reveals high-income countries’ disproportionate impact and emphasizes the need for policy and lifestyle changes.
The ecological footprint is defined as the biologically productive land and sea area required to support a population’s consumption and absorb its waste. This concept, developed by Mathis Wackernagel and William Rees at the University of British Columbia in the early 1990s, gives students, policymakers, and environmental researchers a single, comparable number to measure human demand on nature. Understanding ecological footprint data helps you see not just how much you consume, but whether the planet can actually keep up with that demand. The Global Footprint Network tracks this metric for every country, making it one of the most widely used tools in sustainability science and IB ESS coursework.
What does “explain ecological footprint” actually mean?
The ecological footprint converts all of your resource consumption and waste generation into one unit: the global hectare (gha). A global hectare adjusts for the world-average biological productivity of land and sea, so a forest in Brazil and a wheat field in Kansas can be compared on the same scale. This standardization is what makes the footprint so powerful as a communication tool. Without it, comparing the environmental impact of a diet in Tokyo with one in Lagos would require dozens of separate calculations.
The footprint covers six distinct land-use components of consumption:
- Cropland: Area needed to grow food and fiber crops
- Grazing land: Pasture required for livestock production
- Forest land: Area needed to supply timber and absorb carbon from wood products
- Fishing grounds: Marine and freshwater area required to support seafood harvests
- Built-up land: Area occupied by infrastructure, roads, and housing
- Carbon demand: The forest area required to absorb carbon dioxide emissions from fossil fuels
The carbon component is the largest single driver for high-income nations. In the United States, the carbon footprint component makes up about 64% of the total ecological footprint, with transportation accounting for 37% of those carbon emissions. That single statistic tells you where the biggest reduction opportunities lie for American consumers and policymakers.
Pro Tip: When you calculate ecological footprint for an IB ESS internal assessment, always state which components you are including. Leaving out the carbon demand component will significantly underestimate your result.

How does biocapacity relate to ecological overshoot?
Biocapacity is the supply side of the equation. It measures how much biologically productive area is actually available to regenerate resources and absorb waste within a given region or globally. When a population’s ecological footprint exceeds its biocapacity, the result is ecological overshoot. Overshoot means the population is drawing down natural capital faster than it can regenerate, like spending more than you earn every month.
“Global overshoot has occurred continuously since 1971, signaling that humanity has been in a state of unsustainable resource use for over five decades.” — Global Footprint Network data via CASSE
The scale of this overshoot is striking. Humanity currently requires the equivalent of 1.7 Earths annually to sustain current consumption levels. That represents roughly a 70% overshoot of global renewable capacity, meaning the planet needs almost two years to regenerate what humans consume in one.
Here is how the supply-demand relationship works in practice:
- Calculate the footprint: Add up all land-use components for a population in global hectares per person.
- Measure biocapacity: Determine how many global hectares of productive land and sea are available per person in that region.
- Compare the two: If footprint exceeds biocapacity, the region is in ecological deficit. If biocapacity exceeds footprint, the region has an ecological reserve.
- Track change over time: Monitoring whether the gap is widening or narrowing tells you whether sustainability policies are working.
For IB ESS students, this supply-demand framework is the core analytical lens. The footprint-to-biocapacity ratio is what determines ecological sustainability for a region, not the footprint size alone. A large footprint in a country with abundant biocapacity may be less alarming than a moderate footprint in a densely populated, resource-poor nation.
What do country comparisons reveal about consumption patterns?
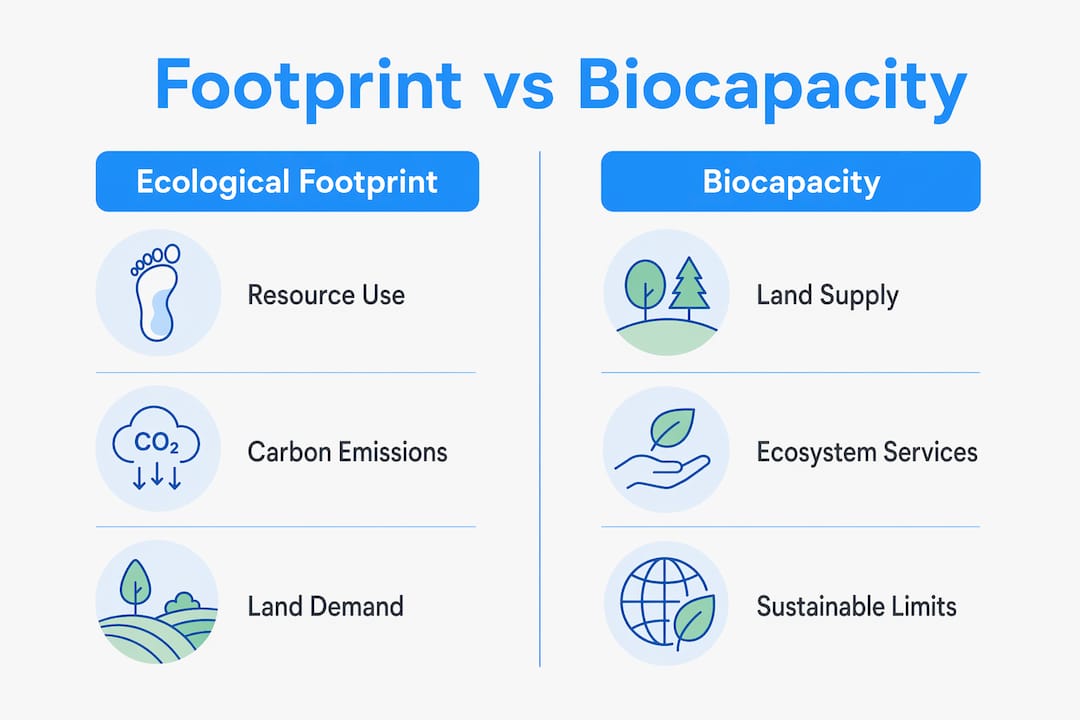
Country-level data makes the ecological footprint concept concrete and often surprising. The numbers below illustrate the gap between high-income and global-average consumption.
| Country / Region | Ecological footprint (gha/person) | Biocapacity (gha/person) | Ecological balance |
|---|---|---|---|
| United States (2022) | 7.9 | ~3.5 | Deficit |
| Global average | ~2.7 | 1.5 | Deficit |
| Low-income countries | ~1.0 | Varies | Often reserve |
The U.S. ecological footprint of 7.9 gha per person is more than five times the global biocapacity of 1.5 gha per person. That means if everyone on Earth consumed like the average American, humanity would need roughly five planets. This is not a hypothetical warning. It is a direct consequence of current consumption patterns in high-income nations.
High-income countries show disproportionate ecological footprints driven by consumption patterns in food, energy, and goods. Population size matters, but consumption per person matters more. China has a larger total footprint than most nations simply due to population, but its per-person footprint remains well below the U.S. figure.
Trade patterns add another layer of complexity. The U.S., for example, imports carbon-intensive products while exporting cropland-intensive goods, which shifts some of its ecological burden onto other countries. This means a nation’s apparent domestic footprint can understate its true global impact. For policymakers, this is a critical insight: consumption-based accounting gives a more honest picture than production-based accounting alone.
How can you use ecological footprint data to reduce your impact?
Understanding ecological footprint data is most useful when it leads to action. Both individuals and governments have clear levers to pull, and the evidence on which ones work best is well established.
Lifestyle choices such as diet, transportation, and energy use are the three biggest drivers of an individual’s footprint. Shifting toward a plant-based diet reduces the grazing land and cropland components significantly. Using public transport or cycling instead of driving cuts the carbon demand component, which, as noted above, dominates the footprint in high-income countries. Switching to renewable energy at home reduces both the carbon and forest land components simultaneously.
Here are the most evidence-backed personal strategies:
- Adopt a plant-rich diet: Reducing beef and dairy consumption lowers grazing land demand more than any other single food choice.
- Use public transport or active travel: Road transport drives 37% of U.S. carbon emissions, so this change has outsized impact.
- Reduce home energy use: Insulation, LED lighting, and heat pumps all shrink the carbon component of your footprint.
- Buy less and buy local: Reducing imported goods cuts the trade-embedded footprint that standard calculators often miss.
- Support renewable energy policies: Individual action scales up when backed by grid-level change.
For policymakers, the ecological footprint and biocapacity framework provides a measurable target. Setting national consumption limits, pricing carbon accurately, and protecting biocapacity through forest conservation are all strategies that directly improve the footprint-to-biocapacity ratio. The Global Footprint Network publishes annual national data that governments can use to benchmark progress.
Pro Tip: If you are writing an IB ESS IA on this topic, check out the ESS IA ecological footprint guide on Esstutor for structured approaches to data collection and analysis.
The ecological footprint metric also builds environmental literacy by quantifying natural capital demands beyond just carbon emissions. This broader view helps students and citizens understand that sustainability is not only a climate issue. It is a land use, food system, and resource governance issue as well.
Key takeaways
The ecological footprint measures human demand on nature in global hectares, and comparing it to biocapacity determines whether a population lives within or beyond planetary limits.
| Point | Details |
|---|---|
| Core definition | Ecological footprint measures biologically productive area needed for consumption and waste absorption. |
| Six components | Cropland, grazing land, forest land, fishing grounds, built-up land, and carbon demand all contribute. |
| Global overshoot since 1971 | Humanity has exceeded Earth’s regenerative capacity continuously for over 50 years. |
| U.S. footprint vs. global biocapacity | At 7.9 gha per person, the U.S. footprint is more than five times the global biocapacity of 1.5 gha. |
| Footprint alone is not enough | Always compare footprint to biocapacity; the ratio determines ecological sustainability, not the number alone. |
Why the ecological footprint is more than just a number
I have worked with IB ESS students for over 13 years, and the ecological footprint is consistently one of the concepts that clicks hardest and sticks longest. That is because it turns abstract sustainability language into a concrete area measurement. When a student realizes that the average American lifestyle would require five planets, something shifts in how they think about consumption.
What I find most underappreciated, though, is the supply side of the equation. Most students arrive knowing vaguely that their footprint is “too big.” Far fewer understand biocapacity or why the footprint-to-biocapacity ratio is the real indicator of sustainability. A country with a large footprint but abundant biocapacity is in a very different position from one with a moderate footprint and almost no biocapacity left. Teaching students to read both sides of that equation is where real environmental literacy begins.
I also push back on the idea that individual action is the whole answer. Personal choices matter, and the data on diet and transport is clear. But the footprint framework was always designed as a policy tool, not just a personal guilt calculator. The most productive use of this data is to inform national consumption targets, trade policy, and land management decisions. Students who understand this distinction write much stronger IB ESS essays and internal assessments.
If you are studying for your IB ESS exams or working on an IA, I encourage you to go beyond memorizing the definition. Practice calculating footprints using real data, compare countries using the Global Footprint Network’s open database, and always ask: what does the biocapacity tell us here?
— Marija
Master ecological footprint concepts with Esstutor
If you are preparing for your IB ESS exams or internal assessment and want to go deeper on ecological footprint analysis, Esstutor offers personalized one-on-one tutoring with an experienced IB examiner. Sessions are tailored to your specific needs, whether that means working through past paper questions, structuring your IA methodology, or building confidence with data interpretation. With over 13 years of IB ESS teaching and examining experience, Esstutor helps students move from surface-level understanding to the kind of analytical thinking that earns top marks. Explore IB ESS IA tutoring to find out how targeted support can make a real difference in your results.
FAQ
What is an ecological footprint in simple terms?
An ecological footprint is the total biologically productive land and sea area required to support one person’s or one population’s consumption and absorb its waste, expressed in global hectares.
How do you calculate ecological footprint?
You calculate ecological footprint by adding up the land area required for cropland, grazing, forestry, fishing, built infrastructure, and carbon absorption, then converting each component into global hectares using standardized productivity factors.
What is the difference between ecological footprint and carbon footprint?
The carbon footprint measures only greenhouse gas emissions, while the ecological footprint includes carbon absorption land plus five other land-use components, making it a broader measure of total environmental demand.
What does ecological overshoot mean?
Ecological overshoot occurs when a population’s ecological footprint exceeds available biocapacity, meaning resources are consumed faster than nature can regenerate them. Global overshoot has been continuous since 1971.
Why does the ecological footprint matter for IB ESS students?
The ecological footprint is a core metric in IB ESS for analyzing sustainability, comparing countries, and evaluating policy effectiveness. It appears in internal assessments, paper 1 data-response questions, and extended essay topics.
No Comments