

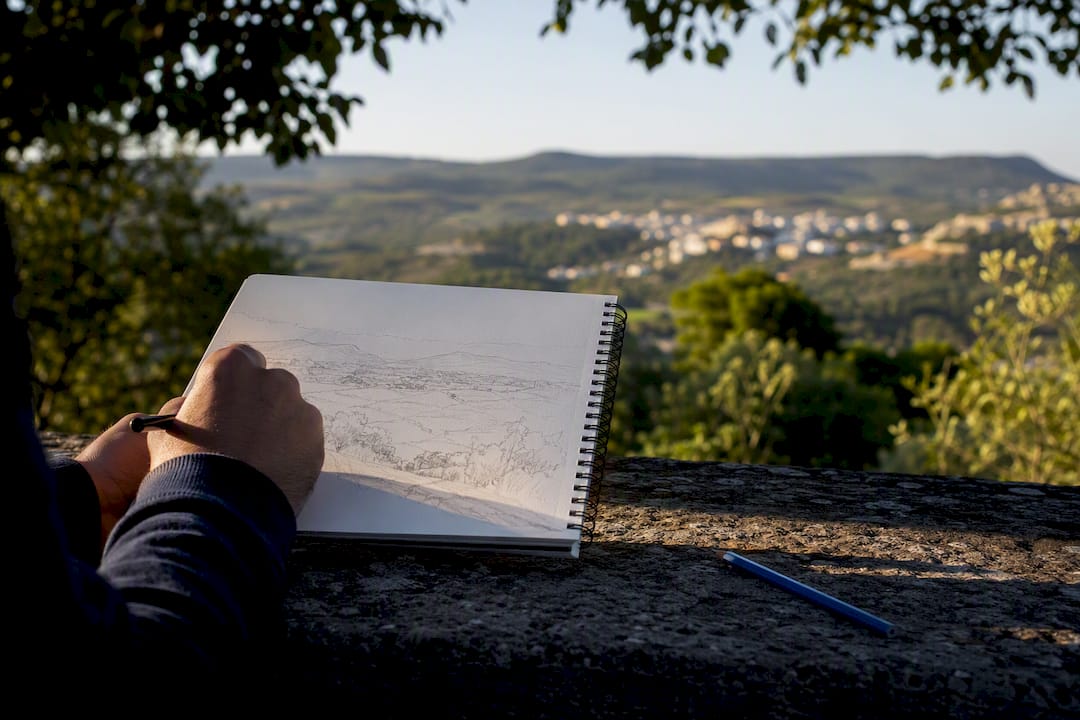
11 Sep Examiner Approved IB Geography and ESS Field Sketches in Six Steps
A field sketch is a hand-drawn, annotated diagram that captures what raw data can’t: the spatial relationships and processes you see at your fieldwork site. It counts as qualitative evidence when it’s tied directly to your research question. Your first move on site is simple: frame the view with your hands or a cardboard frame, draw a rectangle on your paper, mark north and your viewing direction, then work through the steps below.
TL;DR:
- A field sketch must accurately represent features relevant to the research question, not just provide decorative or unrelated detail.
- Annotations should explain processes and implications, not just identify features, to support analysis and higher marks.
- Proper sketching technique involves starting with the skyline, using the thirds method, and including clear scale, orientation, and concise labels.
- The sketch and annotations need to be your own work, backed by backup photos, and should avoid excessive irrelevant detail or copying from others.
- Getting expert feedback on sketches before submission can significantly improve their analytical value and help meet IB assessment criteria.
Table of Contents
- How Do You Draw a Geography Field Sketch Step by Step?
- How Should Field Sketches Fit Into Your IB IA?
- What’s the Difference Between a Label and an Annotation?
- What Mistakes Cost Marks on Field Sketches?
- What Should Be in Your Field Sketch Toolkit?
- An Examiner’s Take on What Turns a Sketch Into Real Evidence
- Want an Examiner to Review Your Field Sketches Before You Submit?
- Sources
How Do You Draw a Geography Field Sketch Step by Step?
Getting the technique right matters more than getting the art right. Examiners aren’t grading your drawing skill. They’re grading whether your sketch is accurate, relevant, and useful as evidence, exactly what the six-step process taught in most geography classrooms is built around.
Start by choosing your view with purpose. Don’t sketch whatever’s in front of you just because it’s there. Ask yourself: does this view actually show something connected to my research question? A river meander study needs the channel and the outer bank erosion in frame, not a nice stretch of unrelated woodland to the left.
- Frame the view. Use your hands, a viewfinder, or a simple cardboard cutout to isolate exactly what you want to sketch. This stops you from including irrelevant clutter.
- Draw the frame on paper. Sketch a rectangle that mirrors the proportions of your framed view, then lightly divide it into thirds, foreground, middleground, and background.
- Start with the skyline. Outline the horizon or the furthest visible ridge, tree line, or building edge first. This anchors your proportions before you add anything else.
- Outline the major features. Work forward from the background into the middleground, adding the larger shapes: slopes, water bodies, vegetation blocks, structures.
- Add foreground detail and texture. This is where the smaller, closer features go, along with any texture that shows surface type, such as scree, sand ripples, or crop rows.
- Transfer slope and scale. Hold your pencil at arm’s length against the scene to judge slope angles and relative heights, then mark a labeled reference object (a person, a gate, a car) so scale reads clearly on paper.
- Number and annotate. Add numbers to key features and write short annotations that explain a process or link the feature to your research question, not just what it is.
- Take backup photos. Snap a few quick shots of the same view so you can check proportions and details later without needing to redraw from memory.
This thirds method, working from background to foreground, is the same approach NSW Education’s field sketch guidance recommends for keeping proportions under control when a scene feels too big to capture.
Pro Tip: Sketch the skyline before anything else, even if it feels like the least interesting part. Students who start with foreground detail almost always run out of paper space before they reach the horizon, and the whole sketch ends up out of proportion.
How Should Field Sketches Fit Into Your IB IA?
A sketch that just sits in your report as decoration earns you nothing. To score, it has to work across three criteria at once.
- Criterion A (focus and method): Your sketch needs a visible line back to your research question and the site’s geographic context. If your question is about coastal erosion rates, your sketch should show the cliff face, wave-cut notch, or defense structures relevant to that question, not a scenic wide shot of the beach.
- Criterion C (data treatment): Sketches count as a qualitative technique alongside your graphs and statistical tests. The IB IA mark scheme expects proper mapping and diagram conventions here: a title, orientation, and clean presentation.
- Criterion D (analysis): This is where most students lose marks. A sketch you never reference again in your write-up is wasted space. Cite it directly (“As shown in Figure 3, the undercut bank suggests active lateral erosion…”) so it feeds your interpretation instead of sitting there unused.
For placement, give every sketch a figure number and a one-line caption stating what it shows and where. Keep captions tight. Long descriptive captions eat into your word count just as much as bloated annotations do, so save the interpretation for your analysis section and let the caption simply identify the figure. If a sketch is purely supplementary, background context rather than core evidence, move it to an appendix and reference it briefly in-text instead of letting it take up prime real estate in your results section. For more on structuring this properly, the ESS fieldwork method guide walks through how sketches slot alongside your other collection methods.
What’s the Difference Between a Label and an Annotation?
Labels identify. Annotations explain. Examiners are looking for annotations, and a sketch covered only in labels reads as descriptive rather than analytical, which caps how many marks it can earn under Criterion D.
-
A label says: “Meander bend.”
-
An annotation says: “Meander bend, ongoing lateral erosion on outer bank increases channel sinuosity over time.”
-
Weak annotation: “Trees on the hillside.”
-
Strong annotation: “Deciduous woodland cover reduces surface runoff, likely explaining lower discharge readings recorded upstream.”
Word count is the trap most students fall into here. IB guidance flags that annotations over roughly 10 words can count toward your IA’s overall word limit, so a page of long, essay-style annotations quietly eats into your 2,500 words before you’ve written a single paragraph of analysis. The fix is straightforward: number each feature on the sketch, keep the annotation next to it short and process-focused, and move any extended reasoning into your written analysis, where it belongs anyway.
Pro Tip: Write annotations as if you’re finishing the sentence “This matters because…”. If you can’t complete that sentence in under ten words, the detail belongs in your analysis section, not on the sketch.
What Mistakes Cost Marks on Field Sketches?
Fieldwork conditions are rarely ideal. Wind flips paper, rain smudges pencil, and your group leader is already moving to the next site. A clipboard with a bulldog clip solves half of this. Pre-drawing your frame rectangle before you even leave the classroom saves precious minutes, and a quick photo backup means a smudged or rushed sketch can still be redrawn properly later.
The most commonly penalized mistakes are avoidable:
- No title, no compass orientation, or no scale indication.
- Labels that just name features without any explanation of process.
- Sketches that are clearly copied from a group member’s version, right down to identical shading and feature placement.
- Excessive irrelevant detail that has nothing to do with the research question, added because it looked interesting on the day.
That copying issue deserves its own warning. Group data collection is fine, but the final sketch and its annotations need to be your own synthesis, not a redrawn version of someone else’s paper. If your group gathered the same field notes together, say so plainly in your methodology, then process and annotate your own sketch independently during write-up. Working from your quick field version and backup photos at home, refine lines, tidy labels, and sharpen annotations, but resist the urge to add new detail you didn’t actually observe on site. That inflates your sketch without adding real evidence, and examiners notice when a “field” sketch looks suspiciously polished.
What Should Be in Your Field Sketch Toolkit?
Keep your kit light enough to carry all day but complete enough that you’re never stuck improvising. An HB or 2B pencil gives you both fine detail and shading control, and RGS guidance specifically recommends pairing sketches with photographs so nothing gets lost between the field and your write-up.
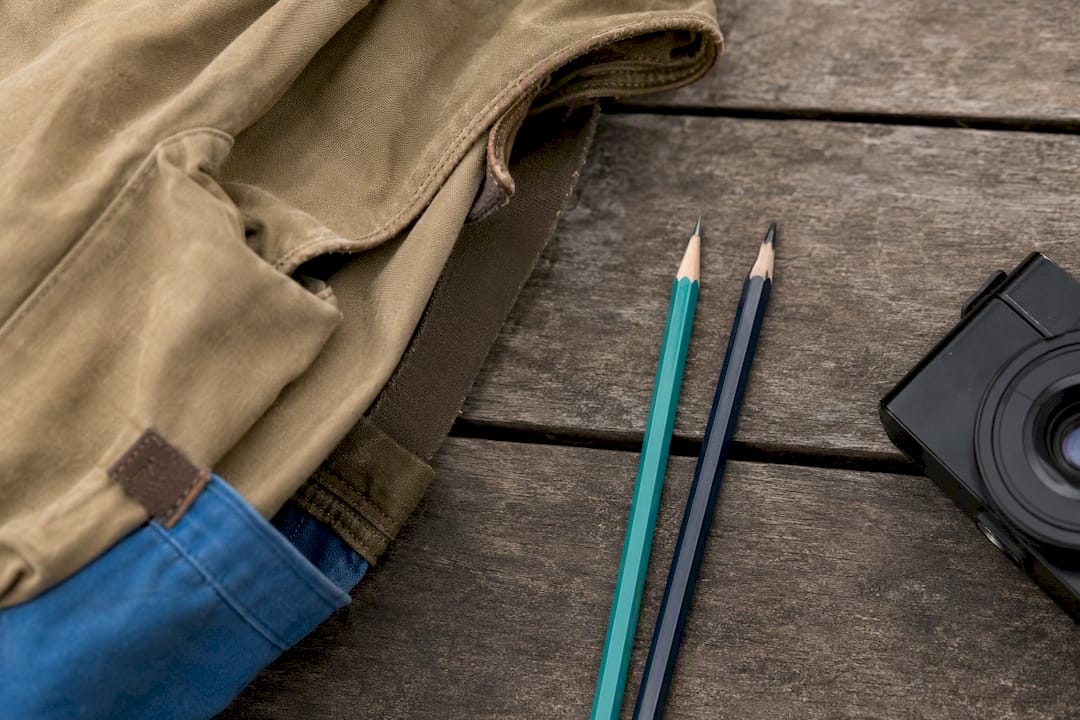
Toolkit: HB/2B pencils, an eraser, a clipboard, plain A4 paper, a small ruler, a compass, a simple cardboard viewfinder, and your phone camera.
6-step field workflow (5 to 10 minutes):
- Choose your view.
- Draw your frame.
- Divide into thirds.
- Sketch the background/skyline.
- Add mid and foreground detail.
- Number, annotate, and photograph.
Photos and scanned sketches are fine to use as backup and for refining detail later, provided the final annotated version submitted in your IA reflects your own observation and analysis, not a redrawn copy of a photograph you never actually stood in front of.
An Examiner’s Take on What Turns a Sketch Into Real Evidence
The gap between a sketch that scores well and one that doesn’t usually isn’t drawing ability. It’s whether the annotations do any analytical work. When I review a student’s first attempt, it’s almost always heavy on labels, “steep slope,” “river bend,” “vegetation,” and light on process. My first question is always: what does this feature tell you about your research question?
The turnaround happens fast once students see it. “Steep slope” becomes “steep slope (35°) increases surface runoff velocity, consistent with the higher turbidity recorded at Site 2.” Same sketch, same fieldwork, completely different mark under Criterion D. The other thing I push hard on is timing: sketch in the field, annotate properly at home with your photos beside you, and never leave the write-up to the night before your IA is due.
— Marija
Want an Examiner to Review Your Field Sketches Before You Submit?
Getting IA feedback from someone who has actually marked hundreds of these against the real criteria makes a difference that generic advice can’t match. Tutoring sessions can work through your sketches line by line: evaluating whether the annotation does analytical work, links to your research question, and is placed correctly against Criterion A, C, and D.

A trial session may include a sketch review, practice rewriting weak annotations into stronger ones, and advice on where each figure belongs in your report. If you’d rather get that feedback before submission than find out after your grade comes back, book a session through Score High IB ESS Internal Assessment with a Tutor and bring your current sketch draft to your first lesson.
Sources
- Field sketches in geography — Internet Geography
- IA mark scheme 2018 onward — IB Geography Pods
- Sketching and photography — Royal Geographical Society (RGS)
- Conducting a field sketch video — NSW Education
No Comments