


07 Sep IB Geography IA Data Analysis: A Practical Workflow
A clear IB Geography IA connects its question, fieldwork methods, data treatment and interpretation. Plan the investigation before collecting data, then check data quality and assumptions before testing. A spreadsheet may be sufficient; GeoDa, GeoPandas and other software are optional tools, not routes to extra marks.
TL;DR:
- Conduct thorough exploratory data analysis by checking for anomalies, outliers, and measurement units before running any statistical tests to avoid disconnection from your research question.
- Justify sampling against the question, variation and practical constraints. Specify a planned hypothesis before collection where appropriate, and distinguish it from patterns discovered later.
- Use software tools that match your coding ability, like GeoDa for beginners or GeoPandas and PySAL for scripting, and always record CRS and reproject data correctly to ensure accurate spatial measurements.
- Design maps and figures with appropriate types, clear labels, and informative captions that directly relate to your research question to satisfy presentation and analysis standards.
- Document all limitations honestly in your evaluation, such as measurement errors or sample size constraints, and suggest concrete improvements to strengthen your IB IA’s credibility.
Table of Contents
- Geographie IA Datenanalyse: The Workflow That Turns Raw Data Into Marks
- How Do Investigation Methods Map to IB Assessment Criteria?
- Choosing Data Types and Sampling Without Guessing
- Which Spatial and Statistical Tests Fit a Geography IA?
- GeoDa, GeoPandas, PySAL, or a Spreadsheet: Which Tool Fits Your IA?
- What Makes a Map or Graph Examiner-Ready?
- Writing an Evaluation Examiners Actually Trust
- Final Checklist Before You Submit
- An Examiner’s View on What Actually Moves the Mark
- Get Feedback on Your IA Before You Submit It
- Sources
Geographie IA Datenanalyse: The Workflow That Turns Raw Data Into Marks
Before you touch a statistical test, look at your numbers plainly. This is the exploratory data analysis (EDA) stage, and skipping it is the single most common reason IA analysis sections feel disconnected from the research question. EDA means checking ranges, spotting outliers, flagging missing values, confirming your units are consistent, and running basic summary statistics like the mean, median, and standard deviation. Geography data analysis at this level splits cleanly into exploratory and confirmatory phases, and treating them as separate steps is what gives your write up structure.
Here’s the sequence that works for most fieldwork-based IAs:
- Run EDA first. Scan for anomalies, check that every measurement uses the same unit, and note anything odd in your data log.
- Check variable types and assumptions. Skewness alone does not require a log transformation. Use transformations only for a justified purpose, consider zeros or negative values, and explain how the transformed scale changes interpretation.
- Aggregate to the right areal unit. If you’re comparing wards, census tracts, or transect segments, decide that unit early and write down why you chose it.
- Separate planned and exploratory analysis. Specify the research question and intended tests before examining results. New patterns may suggest hypotheses, but label these exploratory and avoid claiming independent confirmation from the same observations.
An advance analysis plan can help limit selective reporting. A hypothesis chosen after viewing results should not be described as a prior prediction. Discuss unexpected patterns honestly, including uncertainty and alternative explanations.
Pro Tip: Keep a running data log from day one of fieldwork. Recording anomalies as they happen (a broken sensor, a skipped transect point) saves you from guessing at explanations during write-up.
How Do Investigation Methods Map to IB Assessment Criteria?
Each criterion asks for a different kind of evidence, and conflating them is a common way IAs lose marks they should have earned.
- Criterion A (research question and context): Your question needs to be answerable with the data you can realistically collect. A question about “urban heat island effects across the city” is too broad for a single fieldwork day; narrowing it to two comparable transects makes it feasible.
- Criterion B (methodology): State your sampling strategy explicitly, name your instruments, and write your method steps so another student could repeat them.
- Criterion C (data quality and presentation): Show your cleaning process, note any values you excluded and why, and present figures that follow consistent formatting.
- Criterion D, E, F (analysis, conclusion, evaluation): Every claim in your analysis should point back to a specific figure or test result. Your evaluation should reference the same limitations you flagged during data collection, not new ones invented at the last minute.
The official IB Geography subject guide lays out the exact wording examiners use for each band, and rereading it after a draft catches gaps a checklist alone might miss.
Choosing Data Types and Sampling Without Guessing
Primary data (what you collect yourself) and secondary data (existing datasets, census records, satellite imagery) both belong in a strong IA, but they need different treatment. Primary data needs a clear method students can defend under questioning; secondary data needs provenance, meaning you state exactly where it came from and when it was published.
For typical school fieldwork, two sampling designs cover most scenarios:
- Systematic transects work well for gradients, like distance from a river or from a city center, where you measure at fixed intervals along a line.
- Stratified sampling suits comparisons across distinct zones, like sampling equally from three land-use categories rather than wherever is convenient.
Document your metadata as you go: units, dates, GPS precision, and instrument calibration notes. Before running any test, plot your data with histograms, boxplots, and scatterplots. These simple checks catch outliers and skew that would otherwise distort a correlation or regression later, and they give you material to describe honestly in Criterion C.
Which Spatial and Statistical Tests Fit a Geography IA?
Not every IA needs advanced spatial statistics, but knowing when they help separates a good analysis from a generic one. Exploratory spatial techniques like hotspot mapping and buffer zones are useful early, letting you see clustering before you formalize anything.
- Moran’s I and LISA: Optional spatial methods that require a justified definition of neighbours and spatial weights. They can be applied to suitable point or area data, not only aggregated polygons. Explain the assumptions, significance procedure and, for multiple local tests, the risk of chance findings. These methods are not required for an IA.
- Correlation and simple linear regression are often sufficient for non-spatial relationships, like rainfall against runoff, and are easier to defend under Criterion D if your dataset is small.
- T-tests work when comparing two group means, such as pollution readings from two sites.
Report every test with three parts: the statistic itself, a significance statement, and one sentence tying the result back to your research question. A Moran’s I of 0.42 means nothing to an examiner unless you say what it implies about clustering in your specific dataset.
GeoDa handles LISA and Moran’s I through its interface without requiring code, which makes it the quicker route for most students.
GeoDa, GeoPandas, PySAL, or a Spreadsheet: Which Tool Fits Your IA?
Your choice of software should match your comfort with code, not the other way around.
- GeoDa is free and GUI driven, built for exploratory spatial data analysis. It produces LISA cluster maps and Moran’s I statistics quickly, which makes it the natural starting point if you’ve never coded.
- GeoPandas: A possible option for students comfortable with Python who need to process spatial data. A documented script can help reproducibility, but using code does not itself earn marks; a transparent spreadsheet workflow may be equally appropriate.
- PySAL is the Python library behind many of the spatial statistical routines students see quoted in geography research analysis, useful once you’re comfortable scripting and want Moran’s I or clustering beyond what GeoDa’s interface offers.
- Simpler paths still count: spreadsheet graphs or basic QGIS mapping work fine when coding isn’t realistic for your timeline.
Spatial measurement tip: Record your coordinate reference system and use a measurement method appropriate to the study area and task. A suitable projected CRS can support local distance or area calculations; geodesic methods are another option. Do not treat degrees of latitude or longitude as metres, and consider projection distortion.
What Makes a Map or Graph Examiner-Ready?
Match the figure to what you’re actually showing. A choropleth map suits areal comparisons, like income by district. Graduated symbols fit counts, like population by settlement. A scatter plot fits relationships between two continuous variables.
- Pick the right figure type for the question, not whichever chart your software defaults to.
- Include every design element: a title, labeled axes with units, a legend, a scale bar, a north arrow, and a note on the map projection used.
- Write a caption with three parts: what the figure shows, the key result in numbers, and how that answers your research question, in one or two sentences.
- Reference each figure in your text rather than repeating its data. Interpret it: tell the reader what the pattern means for your argument instead of restating the axis labels in prose.
Clear figures pull double duty. They satisfy presentation standards for Criterion C and give your analysis in Criterion D something concrete to point to.
Writing an Evaluation Examiners Actually Trust
A credible evaluation follows a simple pattern: name a limitation, explain its effect on your results, then suggest a specific fix. “A small sample size limited statistical power, which could have affected the results” is weak on its own; “a larger sample across more transects would let Moran’s I detect clustering with more confidence” gives an examiner something real.
Common limitations worth naming honestly:
- Aggregation errors from choosing areal units that don’t match the underlying process you’re studying.
- Sample size constraints from fieldwork time limits.
- Measurement error from instrument calibration or observer inconsistency.
If you used AI tools or automated classification to process satellite imagery or large datasets, validate the output against local primary data and document where the training data came from, since automated mapping outputs can misclassify features without ground-truthing. For any location-based dataset involving people, note how you handled consent and anonymized identifiable details.
Final Checklist Before You Submit
Run through this before you hit submit:
- Question and sampling: Is your research question specific enough to answer with your dataset, and is your sampling strategy justified in one clear sentence?
- Units and CRS: Are units consistent throughout, and did you state the coordinate reference system for every map?
- Figures: Does every map or graph have a title, legend, scale, and a caption that names the actual result?
- Statistics: Did you report the test statistic and tie it back to the question, rather than just naming the test?
- Evidence: Include the data and processing needed to understand the investigation in the report. An appendix may hold supplementary material where permitted, but must not replace essential assessed evidence.
Replace vague lines like “the data shows a pattern” with the actual number and what it means for your argument.
An Examiner’s View on What Actually Moves the Mark
Most students lose one or two marks not from bad analysis but from analysis the examiner can’t see clearly. A well-run t-test buried under three paragraphs of description reads worse than a weaker test reported cleanly. If I had to pick the single highest-leverage fix, it’s making every figure earn its place: label it fully, caption it with the actual result, and reference it by name in your text.
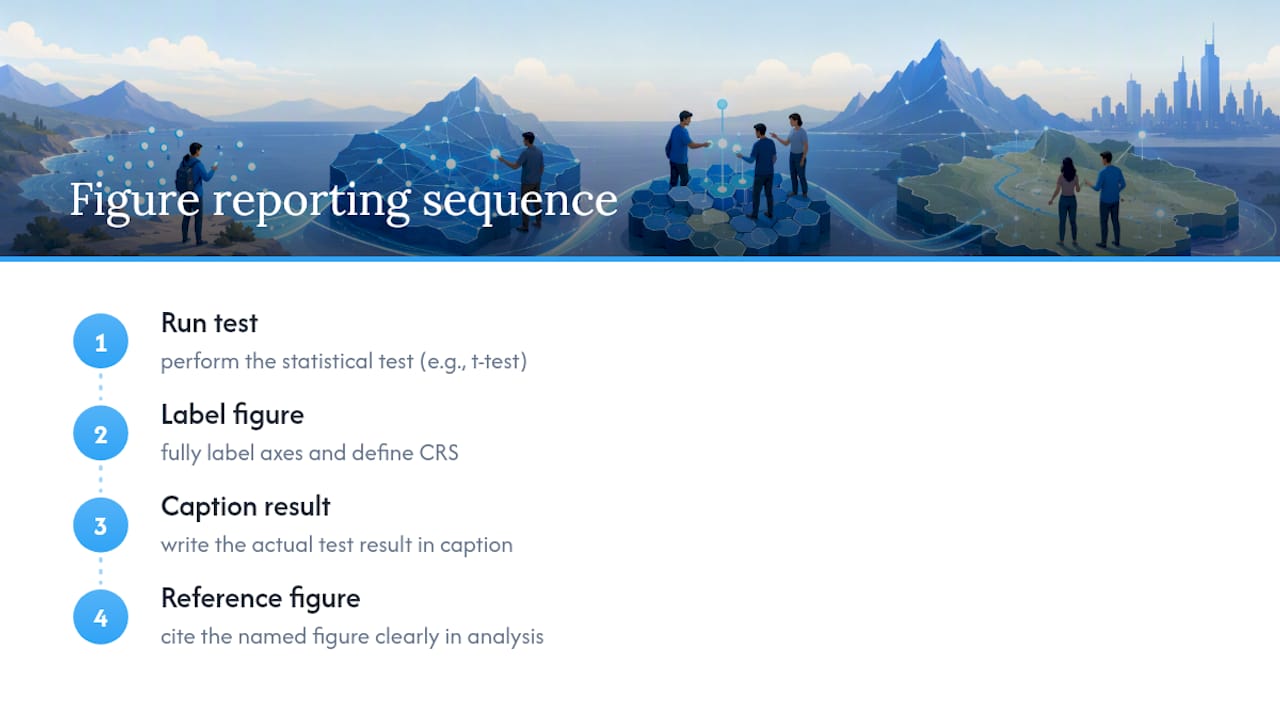
The second habit that consistently lifts scores is documenting sampling decisions as you make them, not reconstructing them from memory during write-up. Students who keep a running data log during fieldwork rarely struggle with Criterion B, because the justification is already written down in their own words from the moment they made the choice.
A second pair of eyes catches the same three or four issues in nearly every IA: unlabeled axes, undefined CRS, a hypothesis that doesn’t match the data collected, or a test reported without interpretation. Catching those early, rather than the week before submission, is usually the difference between a rushed fix and a genuine improvement.
— Marija
Get Feedback on Your IA Before You Submit It
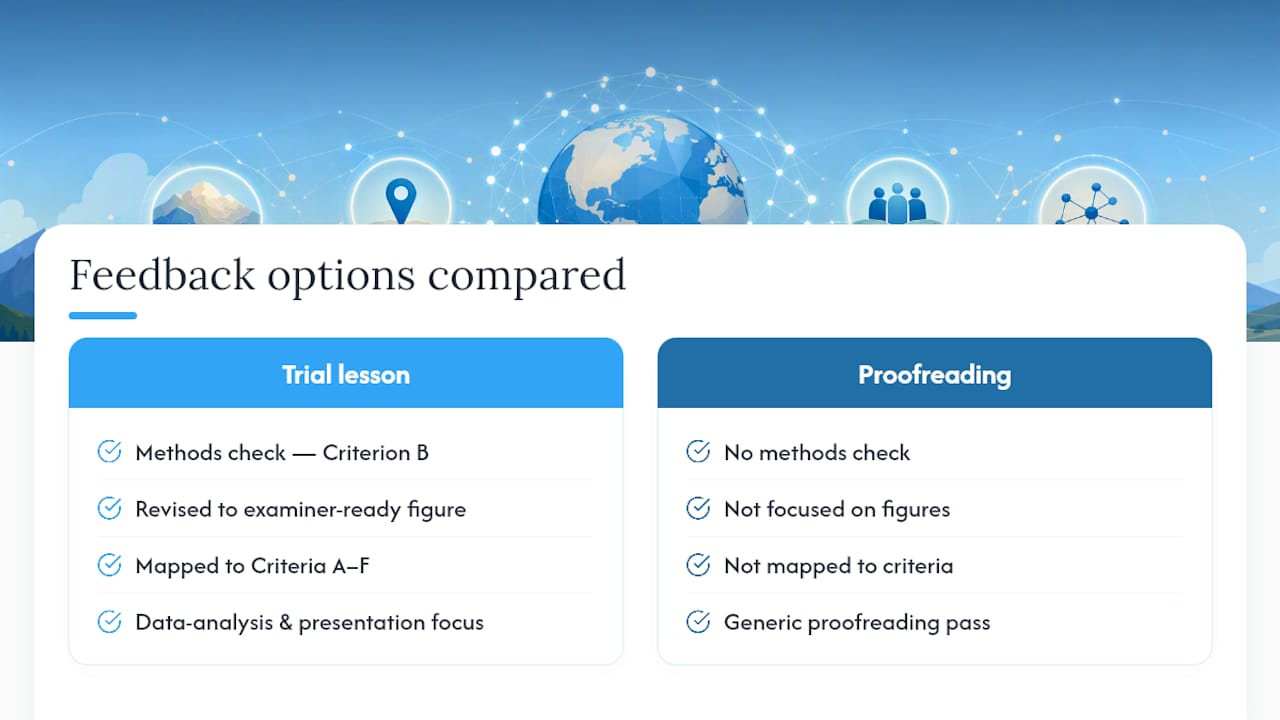
A free 20-minute trial lesson can help identify your needs and discuss suitable support. It does not include a guaranteed full IA review or a rewritten figure. In regular tutoring, you can discuss methods, graph choices and interpretation while producing your own assessed work. Request a FREE 20-minute trial lesson and include your subject, level and current question.
Sources
For criteria and structure, consult the IB Geography subject guide directly. For methods, GeoDa, GeoPandas, and PySAL documentation cover the tools referenced throughout. For clear German-language definitions of core terms, see the Lexikon der Geographie entry on Datenanalyse.
- Datenanalyse – Lexikon der Geographie
- GeoDa – An introduction to spatial data science
- GeoPandas documentation – getting started
- IB Geography subject guide (IA criteria)
No Comments