


28 Jul How to Answer Data Questions in IB ESS: Examiner Method
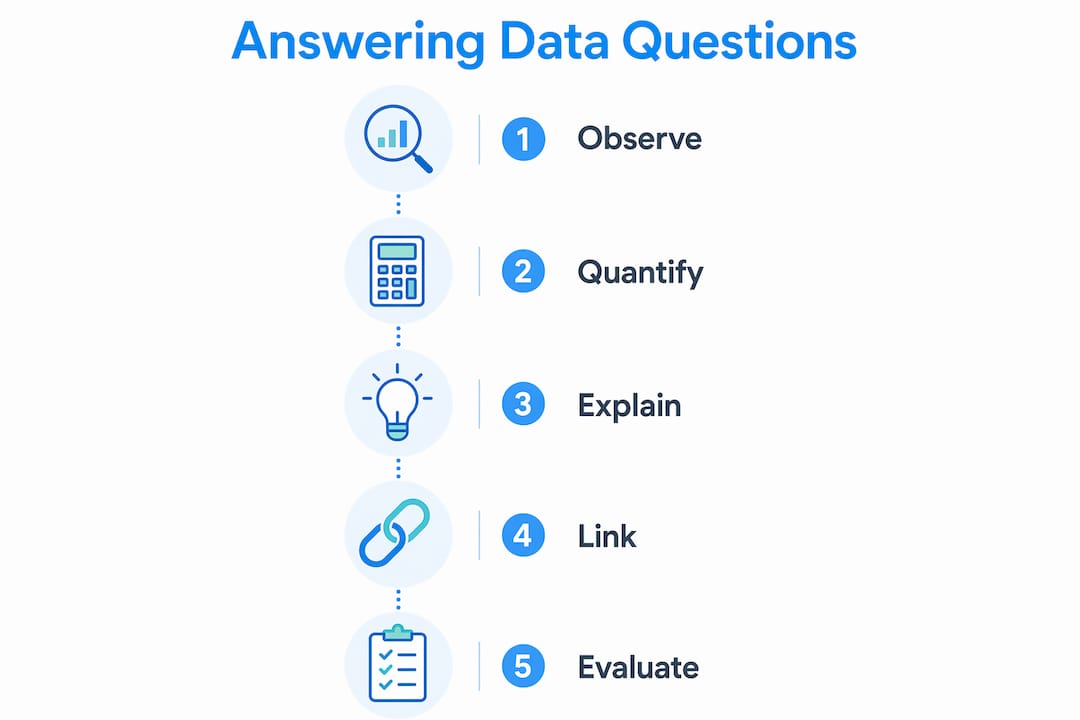
When you see a data question on IB ESS Paper 1, use this five-step protocol immediately: Observe → Quantify → Explain → Link → Evaluate. Read the command term first, scan the axes and units, make one quantified comparison, connect it to an ESS mechanism, and add a limitation only when the command term asks for it. That sequence, applied consistently, is what separates a 3-mark answer from a 6-mark one.
- Observe: Identify the axes, units, scale, time window, and any anomalies before writing a single word.
- Quantify: Pull one concrete figure: an absolute difference, a percentage change, or a rate.
- Explain: Name the ESS mechanism behind the trend (a flow, storage, or feedback loop).
- Link: Connect the data to a syllabus concept or a named case study.
- Evaluate: When the command term demands it, state a criterion-based judgment and one limitation.
According to the IBO markscheme, examiners reward answers that are specific, quantified, and mechanistically grounded. Vague trend descriptions without units or mechanisms rarely earn more than one mark, regardless of length.
Pro Tip: Write the command term at the top of your rough work before you start. It takes three seconds and prevents the most common, most costly error on Paper 1.

Table of Contents
- How should you use reading time on ESS Paper 1?
- What do command terms actually require you to write?
- How do you read graphs and tables and embed calculations?
- How should you structure answers by mark value?
- What mistakes do students most often make on data questions?
- Worked example: a typical Paper 1 data question
- How can you build a practice routine that actually improves your score?
- Key Takeaways
- What examiners actually notice first when reading your answer
- Personalized ESS tutoring that targets your specific data question errors
- Useful sources for ESS data question practice
How should you use reading time on ESS Paper 1?
The reading/preview period before Paper 1 is not downtime. It is your planning window, and using it well can add two or three marks to your total without writing a single answer.
Spend the first few minutes scanning the entire resource booklet. Note the command term for each question, circle axis labels and units, underline the time window on every graph, and flag any anomaly (a sudden spike, a missing data point, a plateau). Teacher guidance recommends spending 10–15 minutes scanning the resource booklet for Paper 1 stimuli before writing anything. Use that time to jot tiny scaffolds in the margin: “% change needed here,” “link to nutrient cycling,” or “evaluate = criteria + limitation.”
| Phase | Time allocation | What to do |
|---|---|---|
| Reading/preview | 10–15 minutes | Scan all stimuli; note command terms, axes, units, anomalies |
| 1–3 mark items | ~1 minute per mark | One clear sentence per mark; include units |
| 4–6 mark items | ~2 minutes per mark | Three-line structure: trend, quantification, mechanism |
| 7–10+ mark items | ~2 minutes per mark | Criterion paragraphs, judgment, limitation |
A practical decision rule: if you have been writing for longer than two minutes per mark and you are still on the first sentence, move on and return. Unfinished short items cost more marks than a slightly underdeveloped long answer.
- Flag questions that need a calculation so you do not skip the quantification step under time pressure.
- Mark any stimulus that maps to a syllabus topic you know well — answer those first.
- Write your scaffold (trend + mechanism + limitation) in the margin during reading time so the writing phase is just filling in the structure.
What do command terms actually require you to write?
Command terms are the clearest signal about the cognitive level an examiner expects. Misreading them is one of the most common, high-cost errors on Paper 1. Each term demands a different register, and writing the wrong one wastes every sentence you produce.
| Command term | Cognitive task | Minimum to earn marks | What earns higher bands |
|---|---|---|---|
| Describe | Report what you see | Trend + units + one data value | Direction, magnitude, and one anomaly noted |
| Explain | Give the reason/mechanism | Trend + named ESS mechanism | Quantified comparison + causal chain |
| Evaluate | Weigh evidence against criteria | One criterion + a judgment | Multiple criteria, evidence for each, stated limitation |
| Discuss | Present multiple perspectives | Two sides with evidence | Balanced weighting + provisional conclusion |
Starter phrases that work:
- Describe: “Between [year A] and [year B], [variable] increased/decreased from [X units] to [Y units], a change of [Z].”
- Explain: “The increase in [variable] is caused by [mechanism], which drives [effect] because…”
- Evaluate: “Using [criterion] as a measure, [option/trend] is [judgment] because [evidence]; however, [limitation].”
- Discuss: “[Perspective 1] suggests… whereas [Perspective 2] argues… On balance, [provisional conclusion].”
Always re-read the command term after you finish writing. Students who write a description when the question says “explain” lose every mechanism mark available.
How do you read graphs and tables and embed calculations?
A mechanical scan before you interpret is non-negotiable. Jumping straight to interpretation is the single most common error on ESS data questions, and it produces unsupported conclusions that examiners cannot credit.
Three-step scan:
- Axes and units: What is on the x-axis? The y-axis? What are the units? Write them in your first line of every answer.
- Category and window: What is being measured, where, and over what time period? Note the start and end values.
- Anomalies and thresholds: Is there a spike, a plateau, or a reversal? Flag it — examiners often build a question around it.
Once you have scanned, embed a calculation. Three formulas to memorize:
- Absolute difference: Final value − Initial value (include units)
- Percentage change: [(Final − Initial) / Initial] × 100
- Average rate of change: (Final − Initial) / number of years (or time units)
Worked formula example: If species richness dropped from 48 to 30 over 6 years:
- Absolute difference: 48 − 30 = 18 species
- Percentage change: [(30 − 48) / 48] × 100 = −37.5%
- Rate: 18 / 6 = 3 species per year
Embed it in one sentence: “Species richness declined by 18 species (37.5%) over 6 years, an average loss of 3 species per year.”
When a question gives you multiple data sources — say, a table of fertilizer inputs alongside a graph of nitrate runoff — cross-reference them explicitly. State which column or line you are citing: “Table 1 shows that fertilizer application doubled between 2005 and 2015, which corresponds to the 40% increase in nitrate concentration shown in Figure 2.” Precision in citing the stimulus is what convinces an examiner you have actually read the data, not guessed at a trend. Specific, filtered comparisons with exact date ranges and categories are a hallmark of high-scoring answers.
Statistic callout: High-scoring data responses routinely follow a 3–4 line pattern: trend with units, one quantified comparison, an ESS mechanism, and a limitation when required by the command term.
How should you structure answers by mark value?
The number of marks tells you exactly how much to write. Longer is not better — precise and complete is.
1. Short answers (1–3 marks)
One clear sentence per mark. Every sentence needs a unit and, where possible, a quantified comparison. Do not explain unless the command term says “explain.”
Example (2 marks, “describe”): “Atmospheric CO₂ concentration increased from 315 ppm in 1958 to 420 ppm in 2023, a rise of 105 ppm.” That is two marks: trend with direction, and a quantified comparison with units.
2. Medium answers (4–6 marks)
Use a three-line structure for each mark cluster:
- Line 1: State the trend with units and a quantified comparison.
- Line 2: Name the ESS mechanism (e.g., positive feedback, bioaccumulation, nutrient cycling).
- Line 3: Link to a named example or case study.
Aim for roughly 60–90 words. More than 120 words for a 4-mark item usually means you are repeating yourself.
3. Extended and evaluative answers (7–10+ marks)
Build one paragraph per criterion. Each paragraph follows: criterion stated → evidence from the stimulus → judgment → limitation or uncertainty. Open with a provisional judgment in the first sentence, then support it. Close with a final, qualified conclusion.
- Suggested length: 180–250 words for a 7–8 mark item.
- Timing: roughly 2 minutes per mark, so 14–16 minutes for an 8-mark question.
- At least two criteria, evidence for each, and one stated limitation are the minimum for the top band.
For deeper guidance on structuring extended responses, the ESS Paper 2 strategies article covers criterion-based paragraph building in detail.
What mistakes do students most often make on data questions?
Most mark losses on Paper 1 are predictable. Here are the errors that appear most often, and what to do instead.
- Skipping the observation phase. Students read the question and start writing an explanation before they have noted the units or the time window. Fix: always write the axis labels and units in your first sentence.
- Misreading the command term. Writing a description for an “explain” question loses every mechanism mark. Fix: circle the command term before you write anything.
- Omitting units. A trend without units (“it increased by 50”) earns zero for that comparison. Fix: write the unit immediately after every number.
- Missing a quantified comparison. Saying “CO₂ levels rose significantly” is not a quantified comparison. Fix: always include a number, a percentage, or a rate.
- Unanchored evaluation. Listing pros and cons without naming a criterion is not an evaluation. Fix: state the criterion first (“Using ecological feasibility as a criterion…”), then weigh the evidence.
- Hedged conclusions without evidence. “It might be better because it could reduce pollution” earns nothing. Fix: cite the stimulus data directly and state a judgment.
Pre-submission checklist (run this before moving to the next question):
- Did I write the units in my first line?
- Did I include one quantified comparison?
- Did I name an ESS mechanism (if “explain” or higher)?
- Did I apply a criterion and state a limitation (if “evaluate”)?
- Does my answer match the command term?
Pro Tip: Keep a personal Error Log after every practice session. Write the question type, the command term, and the specific mark you missed. After three sessions, patterns appear — and those patterns are exactly what to drill next.
For a broader look at common exam errors and how to correct them, the IB ESS mistakes guide covers both IA and exam pitfalls with corrective steps.
Worked example: a typical Paper 1 data question
Stimulus: A line graph shows mean annual temperature (°C) at a boreal forest site from 1980 to 2020. Temperature rises from 2.1°C in 1980 to 4.7°C in 2020. A second axis shows permafrost depth (cm), which decreases from 180 cm to 95 cm over the same period.
Question (6 marks): Explain the relationship between mean annual temperature and permafrost depth shown in the data.
Step 1 — Observe (write units and axes first):
“Figure 1 shows mean annual temperature (°C) and permafrost depth (cm) at a boreal forest site between 1980 and 2020.”
Step 2 — Quantify (show the calculation):
- Temperature change: 4.7 − 2.1 = +2.6°C (a 124% increase)
- Permafrost change: 180 − 95 = −85 cm (a 47% decrease)
“Over 40 years, mean annual temperature rose by 2.6°C while permafrost depth decreased by 85 cm (47%).”
Step 3 — Explain (name the mechanism):
“As air temperature increases, heat transfer to the soil accelerates thawing of the permafrost layer, reducing its depth. This is an example of a positive feedback: thawing permafrost releases stored methane (CH₄), a greenhouse gas that further amplifies warming.”
Step 4 — Link (syllabus term + case study):
“This feedback loop is consistent with the carbon cycle disruption observed in Siberian tundra systems, where methane flux has increased as permafrost thaws.”
Step 5 — Evaluate/Limitation (if required):
“A limitation of this data is that it represents a single site; regional variation in soil composition and vegetation cover may alter the rate of permafrost loss.”
Mark allocation overlay:
- 1 mark: correct trend with units
- 1 mark: quantified comparison (difference or percentage)
- 2 marks: named mechanism with causal chain (positive feedback, CH₄ release)
- 1 mark: case study or syllabus link
- 1 mark: stated limitation
How can you build a practice routine that actually improves your score?
Analytical skills transfer to unfamiliar stimuli only when you practice with varied data sources under timed conditions. Repeating the same question type without an error log does not build the flexibility Paper 1 demands.
Weekly practice template:
- Session 1 (12–15 minutes): Two short data drills (1–3 mark items). Focus: units, quantified comparisons, command-term accuracy. Self-mark immediately against the markscheme.
- Session 2 (12–15 minutes): Two medium items (4–6 marks). Focus: three-line structure, mechanism naming, case study links.
- Session 3 (25–30 minutes): One evaluative drill (7–8 marks). Focus: criterion paragraphs, provisional judgment, limitation.
- Session 4 (30 minutes): Mixed mini-set from a past paper. Timed. Self-mark and update your Error Log.
Decision rule: If you miss the same error tag (e.g., “omitted units” or “no criterion stated”) in two consecutive sessions, repeat that session type the following week before moving on.
Building your Error Log:
- After each session, record: question type, command term, mark lost, and the specific reason (no units, no mechanism, wrong command-term register).
- After three weeks, count which error tag appears most. That tag is your highest-priority drill focus.
- Track three progress markers: (1) units included in every answer, (2) quantified comparison present, (3) criterion stated in every evaluation.
A short diagnostic session with a tutor can identify your top two error tags in a single sitting, saving weeks of unfocused practice. For guidance on using past papers effectively alongside your Error Log, that resource walks through timed self-testing and markscheme comparison step by step.
Key Takeaways
The most reliable method for answering ESS data questions is to follow the Observe → Quantify → Explain → Link → Evaluate sequence on every item, matching the depth of your response to the command term and the marks available.
| Point | Details |
|---|---|
| Follow the five-step protocol | Observe, Quantify, Explain, Link, Evaluate — apply this sequence to every data question. |
| Match depth to mark value | 1–3 marks: one sentence per mark with units; 7+ marks: criterion paragraphs with a judgment and limitation. |
| Always quantify | Include an absolute difference, percentage change, or rate in every answer where data permits. |
| Use reading time strategically | Spend 10–15 minutes scanning the resource booklet, noting command terms, axes, and anomalies before writing. |
| Esstutor diagnostic sessions | A focused session with Esstutor identifies your top error tags and gives you a one-week practice prescription to fix them. |
What examiners actually notice first when reading your answer
After 13 years of tutoring and examining IB ESS, I can tell you that the gap between a 4 and a 6 on a data question almost never comes down to knowledge. It comes down to discipline.
The first thing I look for when reading a student’s answer is whether the units appear in the opening sentence. If they do not, I already know the student skipped the observation phase, and the rest of the answer is likely to be vague. The second thing I look for is a number. Not “it increased significantly” but “it increased by 2.6°C.” Those two habits alone move most students up at least one mark band.
What students underestimate is how much the command term controls the entire answer. A student who writes a beautiful, detailed description for an “evaluate” question has done real intellectual work and earned almost nothing for it. The markscheme is built around the command term, not around how much you wrote. Criterion-based evaluation, with evidence cited directly from the stimulus and a clearly stated limitation, is what the top band actually requires. Most students know this in theory. Very few apply it consistently under timed conditions, because they have not practiced the specific register enough times for it to feel automatic.
The fix is deliberate, error-logged practice with real past-paper stimuli, not re-reading notes. Every session should end with a markscheme comparison and one specific error tag recorded. That habit, more than any other, is what I see move students from the middle band to the top.
Personalized ESS tutoring that targets your specific data question errors
Knowing the five-step protocol is one thing. Applying it reliably under exam pressure, with an unfamiliar stimulus and a ticking clock, is another. That is exactly where online ESS tutoring with Esstutor makes a concrete difference.
A diagnostic session with Esstutor runs 30–45 minutes. Marija reviews your recent past-paper answers, tags the two or three errors costing you the most marks (missing units, wrong command-term register, no criterion in evaluations), and gives you a one-week practice prescription targeting those exact gaps. Sessions include live worked examples with examiner-style commentary, so you see in real time why one sentence earns a mark and the next does not. You also leave with a weekly practice template and a progress-marker checklist calibrated to your current level.
To get started, bring your most recent past-paper attempt and any notes from your Error Log to your first session. Book a trial lesson with Esstutor and find out which two error tags to fix first.
Useful sources for ESS data question practice
Building your skills requires official materials and structured self-testing. Here is a short, curated list to get you started.
- IBO ESS subject brief: The official overview of assessment objectives and command-term expectations. Read this before your first timed practice session.
- IBO ESS curriculum updates: Check here for the most current syllabus changes and assessment model details.
- IBO statistical bulletin: Useful for understanding grade distributions and how the ESS cohort performs globally.
- Tips for IB ESS SL Paper 1: A practical, student-facing guide with Paper 1 specific advice on timing and stimulus interpretation.
- Official IBO past papers and markschemes: Available through your school’s IBO coordinator or the IBO store. Always self-mark against the official markscheme, not just your teacher’s model answer. Pay attention to the exact wording the markscheme uses — that language is the register examiners reward.
- How to use past papers for ESS exam success: A step-by-step guide to timed self-testing and markscheme comparison, with advice on pairing stimuli to syllabus topics.
When you use a markscheme, do not just check whether you got the answer right. Read every accepted response and note which phrases appear repeatedly. Those phrases are the examiner’s preferred register, and using them in your own answers signals that you understand the cognitive task the command term demands.
No Comments