


19 Sep IB ESS Error Bars: SD, SEM and Confidence Intervals
Error bars are the small lines above and below a data point that show how much your results varied or how confident you can be in the mean you calculated. For an IB ESS internal assessment, the single most important habit is simple: state exactly which error bar you used, standard deviation, standard error, confidence interval, or range, and always report your sample size, n, right in the caption.
TL;DR:
- Error bars should be clearly labeled with their type, such as SD, SEM, or confidence interval, and include the sample size in the caption.
- With small samples, show individual observations where practical and explain limitations. Choose SD, SEM or an interval according to the purpose and assumptions, not a fixed sample-size rule.
- Choose SD to describe spread and SEM or confidence intervals to express uncertainty in an estimate. There is no universal sample-size threshold that makes one measure correct.
- Error-bar overlap is not a universal significance rule. Use an appropriate statistical test or interval-based comparison when inference is needed, checking the design and assumptions.
- Always double-check that your error bar choices and labels match your dataset size and justify your selection in your evaluation.
Table of Contents
- What Error Bars Show in IB ESS
- Which Error Bar Fits Your IB ESS Dataset?
- How to Calculate Standard Deviation and SEM by Hand
- Adding Error Bars in Excel, Origin, and Web Chart Tools
- Reading Overlapping Error Bars Correctly
- What Examiners Actually Look for in Your IA Figures
- The Real Problem Isn’t the Formula, It’s the Habit of Skipping It
- Get Examiner-Style Feedback on Your ESS IA Data
- Sources
- FAQ
What Error Bars Show in IB ESS
Error bars turn a single dot on a graph into an honest picture of your data’s reliability. Without them, a bar chart implies your measurement is exact. With them, you’re telling the reader (and your examiner) how much wiggle room actually exists around that number, which is exactly the kind of clarity data visualization guidelines call for when they stress labeled, descriptive graphs with declared error types.
You have four common options, and each tells a different story:
- Standard deviation (SD) measures how spread out your individual data points are around the mean. It answers, “How much did my replicates vary from each other?”
- Standard error of the mean (SEM) measures how precisely your sample mean estimates the true population mean. It shrinks as n grows, even if your raw data stays just as scattered.
- 95% confidence interval: an interval produced by a method that, under its assumptions, would cover the true parameter in 95% of repeated samples. It is not a range containing 95% of the individual observations.
- Range (min to max) simply shows the lowest and highest values you recorded. It’s blunt, transparent, and often the fairest option when you only have a handful of replicates.
Whichever one you choose, name it in the caption. An unlabeled error bar is close to meaningless. Was it SD? SEM? A guess? Your examiner shouldn’t have to ask.
Which Error Bar Fits Your IB ESS Dataset?
Choose the error bar according to what you want to communicate and the assumptions of your analysis. Sample size matters, but does not determine the choice on its own.
- Small samples: show the individual observations where practical and explain the limited evidence. Label any SD, SEM or interval clearly.
- Describing variability: use an appropriate descriptive measure such as SD or range, alongside the data and sample size.
- Estimating a mean: SEM or a confidence interval may be appropriate when assumptions and independence are justified; n = 20 is not a universal cutoff.
Here’s the trap a lot of students fall into: SEM bars shrink as your sample grows, which can make results look far more precise than they really are. SEM is not a measure of spread among your data points; it measures how well your mean estimates the true value, a distinction worth spelling out in your methods section, as the underlying formula makes clear. If you want to make a claim about the wider population rather than just your sample, a 95% CI is usually the more defensible choice, but it demands a larger, more representative dataset to mean anything. Whatever you pick, justify it in your evaluation. A one-line explanation of why you chose SD over SEM (or vice versa) tells the examiner you understand the statistics rather than just following a template.
How to Calculate Standard Deviation and SEM by Hand
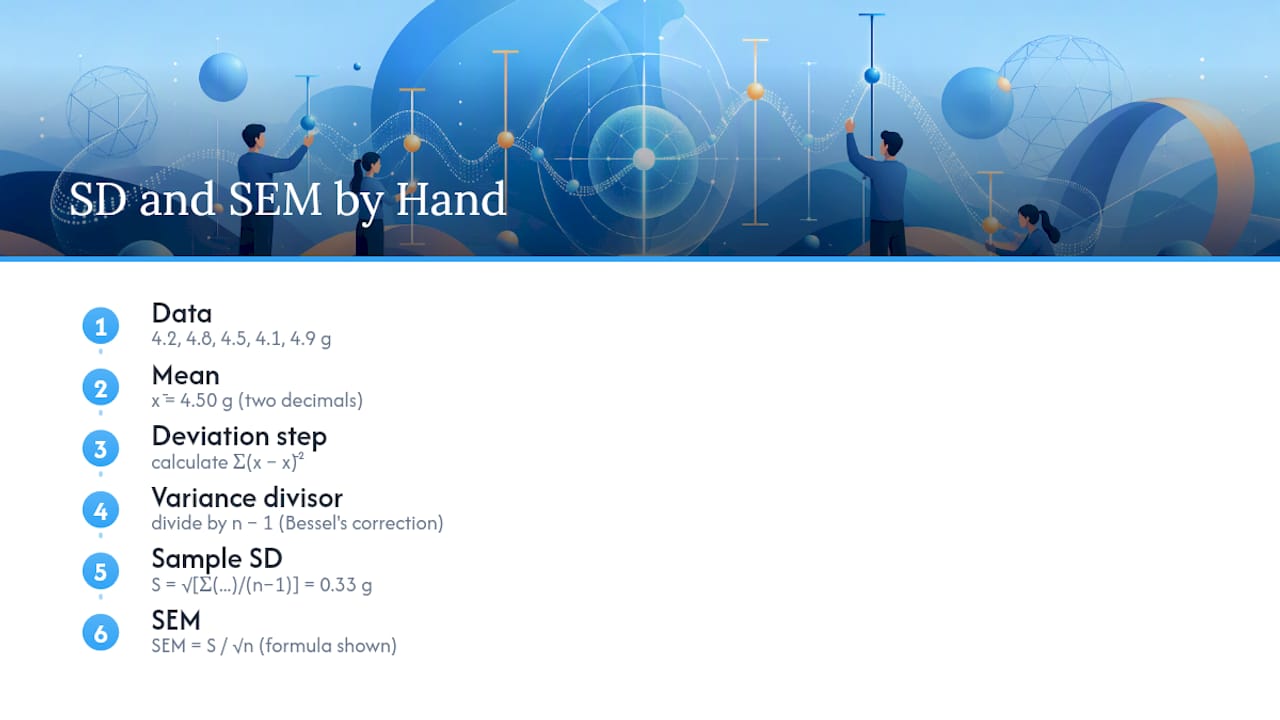
The formulas look intimidating until you run them once. Sample standard deviation is calculated as:
S = √[Σ(x − x̄)² / (n − 1)]
Dividing the sum of squared deviations by n − 1 gives the usual unbiased estimator of population variance under independent random sampling. Taking its square root gives sample SD; that square-root estimate is not itself exactly unbiased. The estimated standard error of the mean is:
SEM = S / √n
Say you measured leaf litter decomposition (in grams lost) across five replicate plots: 4.2, 4.8, 4.5, 4.1, and 4.9 grams.
For these five observations, the mean is 4.50 g, the sample SD is approximately 0.354 g and SEM is approximately 0.158 g. A rounded report is “4.50 ± 0.35 g (mean ±1 SD, n = 5).” State the error type and use consistent decimal places.
Pro Tip: Round your error bar value the same way you round your mean. If your mean is 4.50 g, don’t report an error of 0.334127 g. Match the decimal places, and it instantly reads as more professional.
Adding Error Bars in Excel, Origin, and Web Chart Tools
Most students reach for Excel first, and it handles the basics fine once you know where to look.
- Excel: Select your chart, click the plus icon (Chart Elements), check “Error Bars,” then choose “More Options” to enter custom SD, SEM, or range values instead of Excel’s default percentage. Set consistent cap widths and double check your y axis doesn’t cut off the top of any bar.
- Origin: Assign a dedicated column in your worksheet as the error data before plotting, then Origin lets you control whisker style, direction, and cap width directly through the plot details dialog. This gives more polished output than Excel if you’re already comfortable with the software.
- Web chart tools: If you just need a clean export fast, a browser-based chart maker that accepts custom upper and lower error values can produce a tidy PNG or SVG without installing anything.
- Software with automatic aggregation: Some visualization platforms will calculate error bars directly from raw data using built-in standard error functions, which is convenient but worth double checking against your own hand calculation so you know exactly what’s being plotted.
Before exporting an IA figure, check labels, units and whether the axis range shows the data clearly. Identify any error bars, state sample size and explain the uncertainty measure. No individual formatting choice automatically determines a mark.
Reading Overlapping Error Bars Correctly
Overlapping error bars are one of the most misread signals in an IB ESS IA. Students often assume that if two error bars touch, there’s no significant difference between groups, and if they don’t touch, there definitely is one. Neither assumption is safe.
- Error-bar overlap is a visual clue, not a universal significance rule. Check the measure displayed, study design and assumptions of the inference.
- For independent means under common assumptions, non-overlapping 95% confidence intervals can indicate a difference, while overlapping intervals may still be consistent with a statistically significant difference. Paired data need their own analysis. An appropriate test or interval method can support inference; a test is not the only possible route.
- For the same observations and mean, a conventional 95% confidence interval is wider than ±1 SEM. If the narrower SEM bars overlap, the wider intervals also overlap. Do not compare overlap without first checking the bar type.
Choose an appropriate inferential method if your question requires a comparison beyond the sample. Check independence, paired or unpaired design, distributional assumptions and what parameter the method actually compares. In your evaluation, acknowledge what the error bars visually suggest, then state what the formal test confirmed or contradicted. That contrast, visual impression versus statistical result, is exactly the kind of nuance examiners reward. If you’re unsure which test fits your data, Esstutor’s breakdown of statistical test choices is a good next stop.
What Examiners Actually Look for in Your IA Figures
Marija Maletz has 13 years of teaching experience and more than 10 years as an IB ESS examiner. This checklist focuses on making your figures clear and your interpretation defensible.
- Title, axis labels, and units on every graph. No exceptions, no matter how obvious the axis seems to you.
- Sample size (n) stated clearly, either in the caption or directly on the figure. A graph without n is a graph an examiner can’t fully evaluate.
- Declared error-bar type. “Error bars = ±1 SD, n = 5” takes four seconds to write and answers a question that otherwise costs you marks.
- A caption that connects the figure to your research question, not just a label. Say what’s plotted, why it matters, and what it shows.
The mistake I see most often isn’t a wrong calculation. It’s a missing label. Students calculate SEM correctly, plot it beautifully, and then never tell the reader what it is. Try a template like this: “Figure 3: Mean soil moisture (%) by site, error bars = ±1 SD, n = 6 per site.” Adapt it to your own data and you’ve covered most of the checklist in one line. For a deeper look at recurring pitfalls, Esstutor’s rundown of common IA mistakes is worth a read before you finalize your report.
The Real Problem Isn’t the Formula, It’s the Habit of Skipping It
Most students who lose marks on error bars didn’t misunderstand the statistics. They understood SD and SEM well enough to calculate them correctly, then forgot to say which one they’d used or why. That’s the gap between knowing the math and presenting it the way an examiner needs to see it.
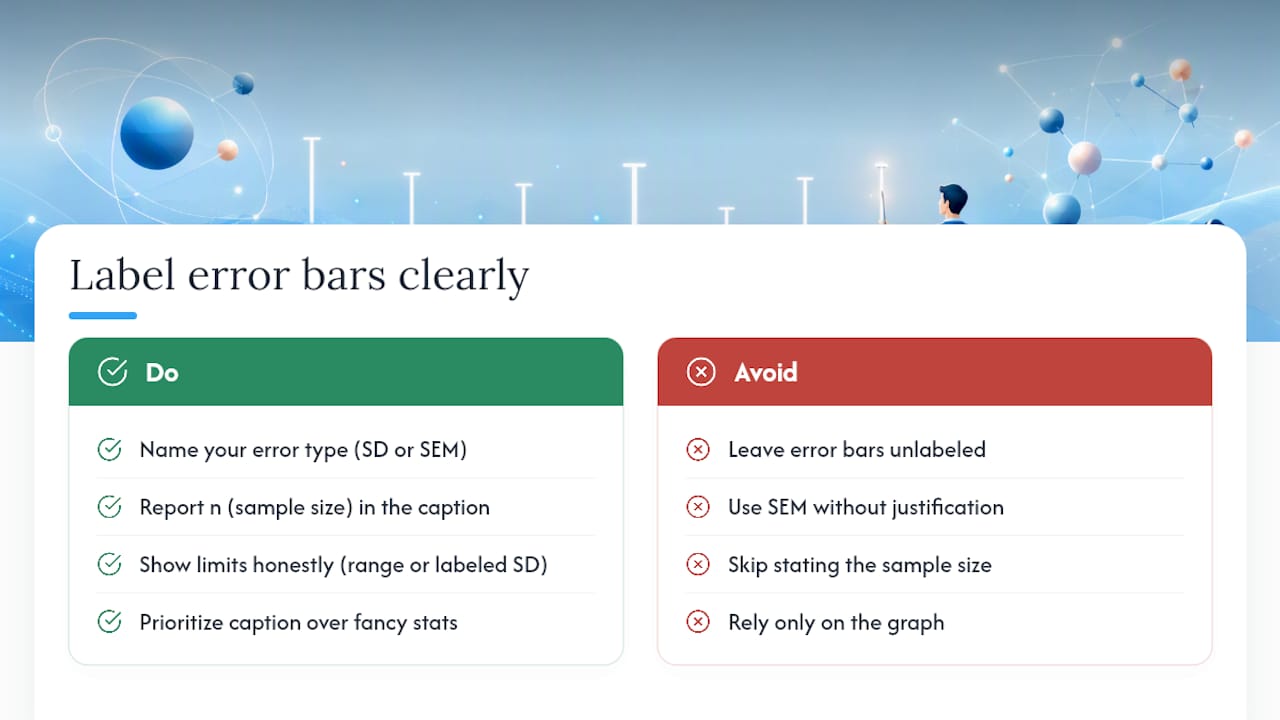
The conventional advice, “just add error bars to your graph,” undersells how much of the grade actually rides on the caption, not the calculation. A perfectly computed SEM with no label is barely better than no error bar at all, because the reader has no way to judge what it means. If you take one thing from this article, prioritize the sentence that names your error type and your n over chasing a more sophisticated statistical measure you can’t fully justify.
It needs honesty about its limits, shown through range or a clearly labeled SD, and a caption that does the explaining your graph alone can’t do.
— Marija
Get Examiner-Style Feedback on Your ESS IA Data
Reading about error bars is one thing. Getting specific feedback on whether your calculation, your chosen measure, and your caption would actually satisfy an examiner is another. The tutoring is built around exactly that gap, with personalized sessions from an experienced IB examiner and ESS teacher who has graded numerous assessments.
Book a free 20-minute trial lesson to discuss your ESS questions. For regular sessions, see current prices. Bring your own dataset and calculations for guidance; your assessed analysis and writing remain your own.
Sources
- Kr8
- Visual inference and overlapping error bars — PMC article
- Data visualization guidance — Harvard accessibility / data viz
- Origin documentation — add error bars to a graph
FAQ
What Is the Difference Between SD and SEM in an IA?
Standard deviation shows how spread out your individual data points are around the mean, while standard error of the mean shows how precisely that mean estimates the true population value. SEM is calculated as S divided by the square root of n, so it shrinks as your sample size grows even if the underlying data stays just as variable.
Do I Always Need to Show n on My IA Graph?
Yes. Examiners consistently look for sample size stated clearly in the caption or on the figure itself, since it’s impossible to judge whether SD, SEM, or a range is the right choice without knowing how many replicates you collected.
Can I Use SEM With Only Four or Five Replicates?
You can, but many educators recommend range or a labeled SD instead when n is this small, because SEM can imply a level of precision your limited dataset doesn’t actually support. Plotting the raw replicate points alongside your mean is often the more transparent choice.
Do Overlapping Error Bars Mean There’s No Significant Difference?
Error-bar overlap is a visual clue, not a universal significance test. Check what the bars represent and whether observations are independent or paired. Suitable statistical tests or interval-based comparisons can support inference; neither overlapping nor non-overlapping bars alone establish a rule that fits every design.
Recommended
- ESS IA Data Analysis Guidance
- 3 Examiner Ready IB ESS IA Methods: Checklist, Stats, Examples
- ESS IA Graphs: Create Examiner-Ready Visuals for IB ESS
- Top ESS scores: examiner insights and pro tips 2026
Further reading: Nature Methods: Error bars.
No Comments