

12 Sep Primärdaten in IB Geography: 5 Examiner Tips to Nail Your IA Methods
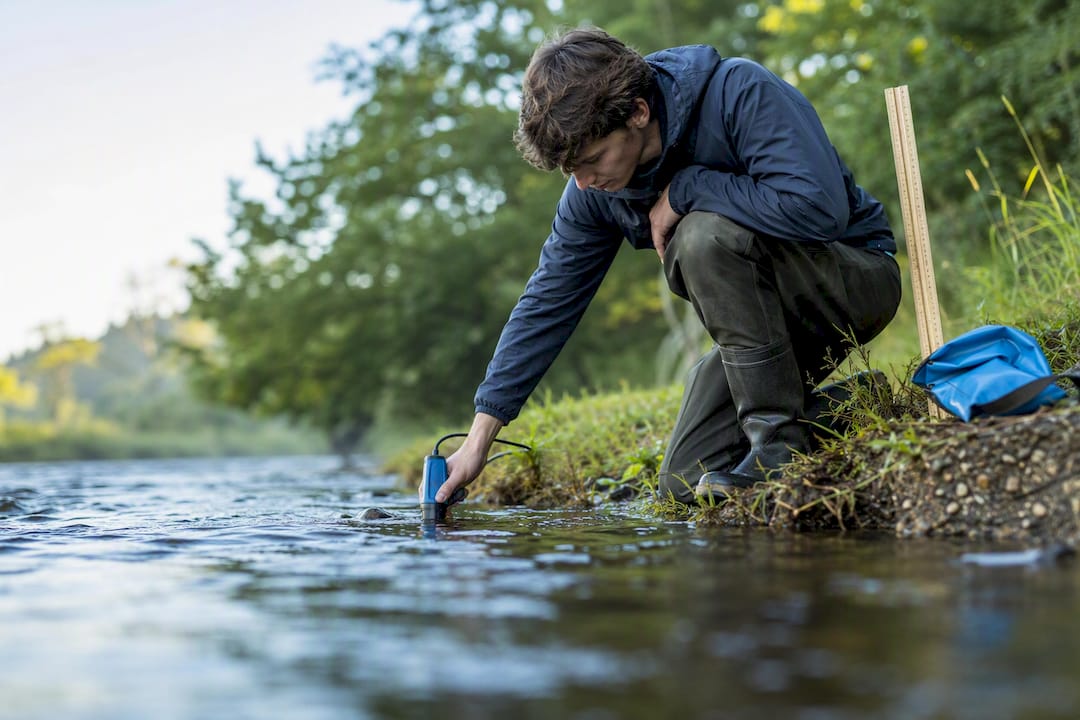
Primärdaten, or primary data, means the measurements, counts, surveys, and photographs you collect yourself during fieldwork rather than borrowing from a government report or textbook. Every IB Geography IA lives or dies on this distinction, because examiners assess how well you designed, collected, and justified your own evidence. As Marija, an experienced IB examiner and tutor, will tell you: get this definition right first, and the rest of your methods section writes itself.
TL;DR:
- Using a deliberate sampling method aligned with your research question, such as stratified sampling, enhances the representativeness of your primary data.
- Justifying your choice of data collection methods and sample size is more critical to scoring well than simply collecting large amounts of data.
- Incorporating spatial analysis and clear presentation formats, like maps and charts with captions, strengthens your evidence and interpretation.
- Addressing potential errors, limitations, and ethical considerations with specific improvements demonstrates understanding of reliability and validity.
- Combining primary data with secondary sources can deepen analysis, but your justification of each source’s purpose influences your overall evaluation.
Table of Contents
- Primärdaten Defined: What Counts as Primary Data in Geography
- Field Methods for Collecting Primary Geographic Data
- Sampling Techniques That Reduce Bias in Fieldwork
- Presenting Primary Data: Maps, Charts, and Basic Spatial Analysis
- Evaluating Reliability, Validity, and Ethics in Fieldwork
- Examiner Tips for Writing Up Primary Data Methods
- Why Primary Data Gets Undervalued in Geography IAs
- Sources
- FAQ
Primärdaten Defined: What Counts as Primary Data in Geography
Primary data are measurements or observations you gather first-hand, whether that’s a pedestrian count on a high street or a river velocity reading with a flow meter. The GIS Commons textbook frames this simply: if you were physically present when the data came into existence, it’s primary. Secondary data, by contrast, was collected by someone else for a different purpose, like census figures or a published land-use survey.
Not everything you observe qualifies equally. A footfall count is observable and repeatable. A resident’s opinion on regeneration is still primary, but it’s qualitative and harder to standardize than a tape measurement.
A typical IA question like “How does channel velocity change downstream on the River X?” might draw on this list of primary data:
- Flow velocity readings at multiple points along the channel
- Pebble size and roundness measurements at each site
- Channel width and depth at each cross section
- Photographs documenting bank erosion or deposition
- Field sketches noting land use adjacent to the river
Strong IAs rarely rely on primary data alone. Combining primary data with secondary sources and explaining why you chose each one is exactly what separates a Level 5 methods section from a Level 3. If you want a deeper walkthrough of pairing the two, Esstutor’s guide to secondary data in the ESS IA breaks down when a secondary dataset actually strengthens your argument.
Field Methods for Collecting Primary Geographic Data
Choosing the right method depends on your enquiry question, your equipment, and how much time you actually have on-site. Here’s how the main techniques break down:
- Field mapping and cartography: Decide your indicators before you go out, use consistent symbols, and record grid references or GPS coordinates alongside every observation. The Geo-Exkursionsportal’s mapping methodology recommends posing your map question first, then building the symbol key around it, so the final map answers something specific rather than just showing “stuff.”
- Questionnaires and interviews: Keep questions short, neutral, and closed where possible. Structured questionnaires remain a core teaching tool in school geography precisely because they’re standardized and easy to compare across respondents.
- Direct measurement: Tape measures for channel width, clinometers for slope angle, flow meters for velocity, and a smartphone GPS for accurate coordinates. Record units every time.
- Drone or remote imagery you capture yourself: This counts as primary data, but only if you document the date, altitude, and camera settings.
- Data sheets: Design a sheet before fieldwork, not during it. A messy spreadsheet after the fact costs more time than it saves.
Pro Tip: Pilot test your questionnaire on five to ten people before your real fieldwork day. A small pilot run catches ambiguous wording and interviewer bias before it contaminates your actual dataset.
Sampling Techniques That Reduce Bias in Fieldwork
Your sampling method needs a name and a reason, not just a description of what you did. Examiners want to see that you picked random, systematic, or stratified sampling deliberately, based on your research question and site constraints.
- Random sampling: Every point or respondent has an equal chance of selection. Good for large, uniform populations like a beach pebble survey.
- Systematic sampling: You sample at regular intervals, say every tenth pedestrian or every 10 meters along a transect. Useful when you need even spatial coverage.
- Stratified sampling: You divide the population into groups (age, land-use zone, distance from a CBD) and sample proportionally within each. Stratified sampling can be combined with random or systematic methods to boost representativeness without extra fieldwork time.
Sample size comes down to a trade-off between statistical confidence and how many hours you actually have on-site. A larger number of pedestrian counts taken in a single session beats fewer counts spread over a longer period if consistency matters more than volume.
When you write up your methods, use direct justification rather than description. A line like “Systematic sampling was chosen at 20-meter intervals to ensure even coverage of the entire 400-meter transect, minimizing selection bias” tells the examiner you understand why, not just what. For a deeper set of examiner-approved templates, see Esstutor’s guide on sampling methods for IB Geography fieldwork.
Presenting Primary Data: Maps, Charts, and Basic Spatial Analysis
A map without a scale bar, north arrow, and legend loses marks before an examiner even reads your interpretation. Every map needs a coordinate note (grid reference or GPS coordinates) so a reader can locate your study site without guessing.
Chart choice should match your data type, not your aesthetic preference:
- Histograms for continuous data with many values, like pebble size distribution
- Scatter plots for testing a relationship, such as distance from source versus velocity
- Boxplots for comparing spread and outliers across sample groups
- Bar charts for categorical comparisons, like land-use type by zone
Beyond static charts, basic spatial operations like buffers and overlays let you visually test relationships, such as whether erosion sites cluster within a certain distance of a footpath. You don’t need professional GIS training. Free tools like GeoDa handle simple mapping and spatial statistics well within an IA’s scope.
Every map or chart needs a caption that states what it shows and a short line connecting it back to your research question. Esstutor’s four-step IA data analysis workflow walks through exactly how to move from raw field data to a finished, examiner-ready figure.
Evaluating Reliability, Validity, and Ethics in Fieldwork
Reliability means you’d get the same result if you repeated the measurement. Validity means you’re actually measuring what you intend to measure. A leaking flow meter gives unreliable readings; asking leading survey questions gives invalid ones, even if every respondent answers consistently.
- Test reliability directly: Take two measurements at the same point and compare them. A big gap signals instrument or technique error.
- Report measurement and sampling error honestly: State the likely margin, don’t just claim your data is accurate.
- Follow an ethical checklist: Get informed consent for interviews, keep responses anonymous, and stay within teacher-supervised sites for safety.
- Write limitations plainly: “Wind speed during data collection may have affected pedestrian counts near the coastal transect” reads far better than a vague “there were some limitations.”
Pro Tip: When suggesting improvements, name a specific fix, not a general one. “Repeat sampling across three separate days to account for daily variation” scores higher than “more data would help.”
Examiner Tips for Writing Up Primary Data Methods
Marija has read hundreds of IA methods sections, and the ones that score highest all do the same few things well. Here’s a quick checklist worth running your draft against:
- State your sampling method by name, then justify it against your research question in one sentence.
- Name every instrument used and its precision (e.g., “flow meter, accurate to 0.01 m/s”).
- Link each data type back to a specific sub-question, not just the overall enquiry.
- Include a limitation and a concrete improvement for at least two data collection methods.
- Avoid vague phrases like “enough data was collected.” State the actual sample size.
A sentence template that consistently works: “Method] was used to collect [data type] because [reason tied to research question], with [sample size/interval] chosen to balance [time/resource constraint].” For a fuller breakdown of how each method maps to IB grade boundaries, Esstutor’s [IA data analysis workflow guide is worth working through alongside your first draft. If you want a second pair of eyes on your methods section before submission, personalized ESS and Geography tutoring can catch the gaps a rubric alone won’t show you.
Why Primary Data Gets Undervalued in Geography IAs
Most guidance on primary data treats it as a box to check: collect it, put it in a table, move on. That’s backwards. The research consistently points to justification, not collection, as the actual mark differentiator. Examiners don’t reward students for gathering data. They reward students for explaining why that data, why that sample size, and why that method, in direct relation to the enquiry question.
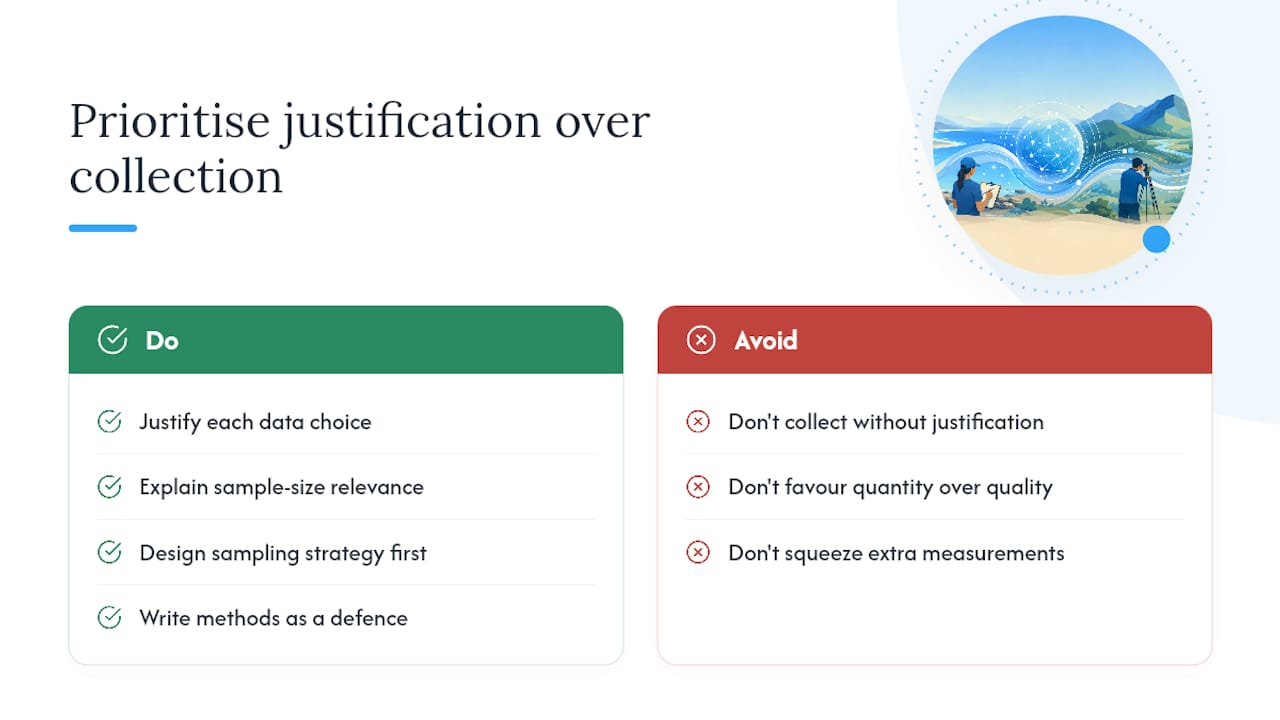
The conventional advice to “just collect more data” also misses the point. A smaller, well-justified dataset with clear limitations beats a large, sloppy one every time. If you have limited fieldwork time, spend it on designing your sampling strategy properly rather than squeezing in extra measurements.
My honest read: students should prioritize the justification sentence over the data point itself. Write your methods section as if you’re defending a decision, not describing an activity. That shift in mindset, more than any instrument or app, is what moves an IA from a Level 3 to a Level 6 on the criteria that actually count.
— Marija
Sources
- Primary and Secondary Data — PrepWise
- Collecting data – Eduqas Fieldwork – BBC Bitesize
- What Is Spatial Data Analysis? — USC GIS
FAQ
What Are Primary Data and Secondary Data in Geography?
Primary data are first-hand measurements or observations you collect yourself, like a river velocity reading or a pedestrian count. Secondary data were collected by someone else for another purpose, such as census statistics or a published survey.
What Is Primärdaten in IB Geography?
Primärdaten is the German term for primary data, meaning direct field evidence you collect during your own fieldwork, like measurements, counts, surveys, or photographs, rather than data sourced from existing reports.
What Are the Three Pillars of Geography?
Geography is commonly organized around physical geography, human geography, and environmental (or integrated) geography, though definitions vary slightly by curriculum and institution.
What Are the Most Important Terms in Geography?
Key terms students should know for IB Geography fieldwork include primary data, secondary data, sampling, reliability, validity, and spatial analysis, each of which shows up repeatedly in IA assessment criteria.
How Much Primary Data Do I Need for an IB Geography IA?
There’s no fixed number, but sample size should balance statistical confidence against your available fieldwork time, with strong IAs stating and justifying the exact size chosen rather than an arbitrary figure.
No Comments