


22 Jun Why Measure Ecological Indicators: A Student Guide
TL;DR:
- Ecological indicators help assess ecosystem health by simplifying complex data into actionable signals. They serve as early warnings of species decline and habitat loss, enabling timely management actions. Using well-chosen indicators supports sustainability and conservation while being practical for education and policy.
Ecological indicators are measurable components of ecosystems used to evaluate environmental conditions and track changes over time. Understanding why measure ecological indicators matters is central to environmental science, whether you are studying for the IB ESS exam or conducting fieldwork. These indicators simplify complex ecosystem data into signals that scientists, educators, and policy-makers can actually use. They cover everything from indicator species and biodiversity indices to water quality metrics and habitat condition scores. Knowing how to read and apply them gives you a real advantage in both your studies and any future work in conservation or sustainability.
Why measure ecological indicators for ecosystem health?
Ecological indicators simplify complex environmental data into actionable information, making cost-effective monitoring and management decisions possible. Counting every organism in an ecosystem is not realistic. Instead, scientists select a small set of indicator species or taxa that reflect the broader health of the system. A drop in mayfly populations in a stream, for example, signals declining water quality long before a chemical test might confirm it.
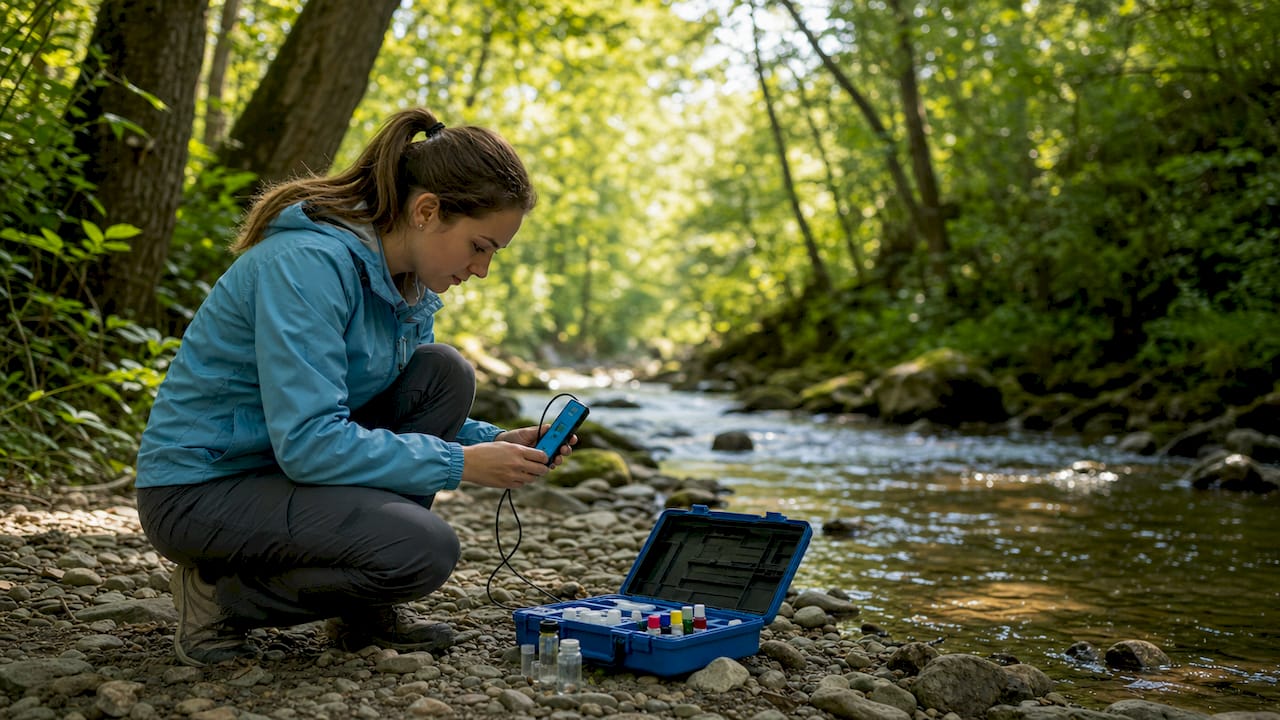
This is why the importance of ecological indicators goes beyond data collection. They give you a way to assess ecosystem health without exhaustive surveys. Biodiversity indices like the Shannon Index or Simpson’s Index condense species richness and abundance into a single number. That number tells a story about ecosystem stability that a species list alone cannot.
Ecological indicators also connect to environmental literacy, which is a core skill in IB ESS. When you understand what an indicator measures and why it was chosen, you can evaluate environmental reports critically rather than just accepting their conclusions.
How do ecological indicators provide early-warning signals?
Ecological indicators serve as critical early-warning signals, allowing environmental managers to identify species decline or habitat loss before crises develop. Think of them as a smoke detector for ecosystems. They alert you to problems while there is still time to act.
Here are the key ways indicators function as early-warning tools:
- Species decline signals: A reduction in apex predator populations, such as sharks in a reef system, often precedes broader food web collapse.
- Habitat degradation signals: Declining lichen cover on trees indicates rising air pollution levels before visible damage appears.
- Water quality signals: Macroinvertebrate community shifts in rivers reflect changes in dissolved oxygen and nutrient loading.
- Phenological shifts: Changes in flowering times or migration patterns signal climate-driven ecosystem stress.
In marine ecosystems, linking ecological with social welfare metrics enhances management pathways significantly. When fisheries managers track both fish stock indicators and the livelihoods of coastal communities, they make better decisions than when they track fish stocks alone.
Pro Tip: When you study indicator species for your IB ESS internal assessment, always explain what the indicator signals and why it is sensitive to that specific environmental change. That causal link is what examiners look for.
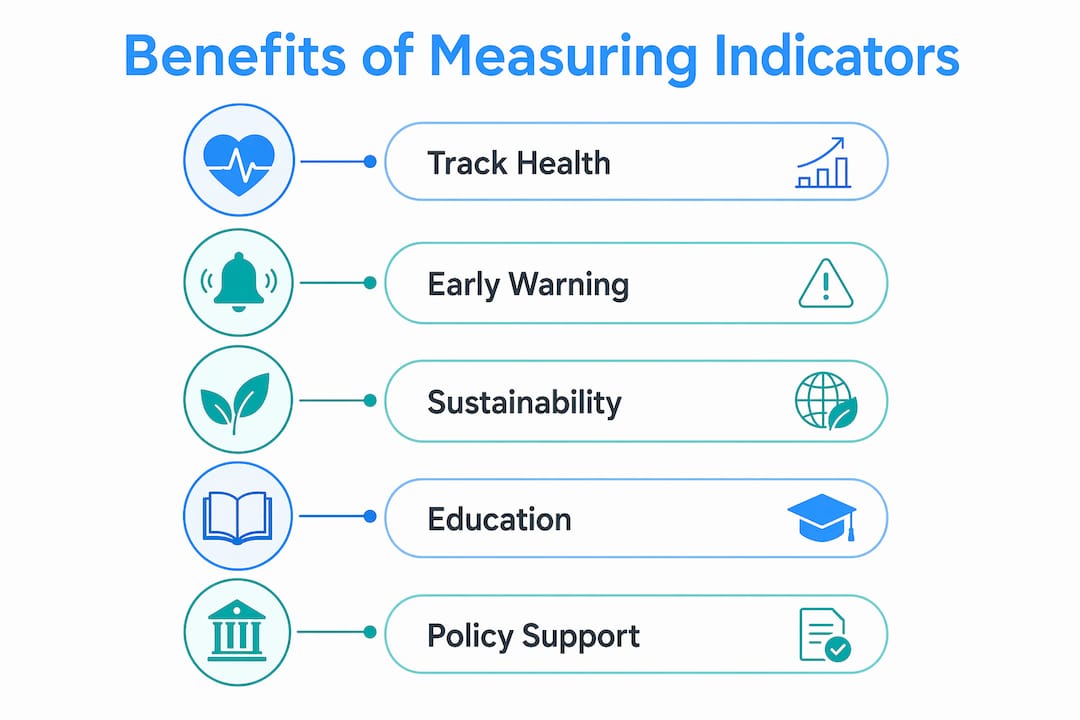
What are the benefits of measuring indicators for sustainability?
The benefits of measuring indicators extend well beyond academic exercises. Ecological indicators communicate complex ecosystem data effectively to non-scientists, including policy-makers and the public, enabling evidence-based decisions. This communication function is one of the most underrated advantages of the whole system.
Practical benefits include:
- Cost efficiency: Monitoring a few well-chosen indicator species costs far less than surveying entire ecosystems. This makes regular monitoring financially realistic for governments and NGOs.
- Time efficiency: Indicator-based assessments produce results faster than comprehensive biodiversity surveys, which can take years.
- Policy alignment: Ecosystem condition indicators are validated as proxies for regulating services like climate regulation and water purification, directly supporting UN Sustainable Development Goals SDG 14 (Life Below Water) and SDG 15 (Life on Land).
- Public engagement: Simple indicators like the Living Planet Index or national species trend reports make ecosystem health understandable to general audiences.
The connection between ecological indicators and sustainability is direct. When governments track biodiversity indicators over time, they can demonstrate progress toward international commitments like the Kunming-Montreal Global Biodiversity Framework. Without indicators, those commitments remain unmeasurable and therefore unenforceable.
Why use ecological metrics rather than full ecosystem surveys? Because a minimal robust set can signal ecosystem collapse trends effectively, giving managers time to intervene before damage becomes permanent.
What are the challenges in selecting and interpreting indicators?
Selecting the right ecological indicators is harder than it looks. The trade-off between scientific detail and practical usability is real, and getting it wrong leads to poor decisions.
The biggest conceptual trap is Goodhart’s Law. When indicators become targets, they risk losing their effectiveness and promoting symbolic compliance. In conservation, this plays out when managers focus only on measurable species because data exists, while ignoring ecologically significant but harder-to-measure processes like soil microbial activity or seed dispersal networks.
“Indicators are diagnostic navigation tools rather than ultimate goals, enabling early course correction and adaptive management.” The moment you treat an indicator as the destination, you stop seeing what it was pointing at.
Here are the main challenges you need to understand:
- Proxy limitations: Species indicators distill complex data into trends for policy and monitoring, but they do not capture localized changes or causality. A national bird population trend may look stable while local breeding sites collapse.
- Indicator selection bias: Practitioners often default to species with existing data rather than species most sensitive to the stressor being monitored.
- Social-ecological integration gaps: Only 9 out of 148 marine indicators meet full social-ecological criteria. Most marine indicators track ecological states without linking them to human welfare outcomes.
- Temporal mismatch: Some ecosystem changes take decades to appear in indicator data, making short-term monitoring misleading.
- Confounding variables: An indicator may respond to multiple stressors simultaneously, making it hard to identify the cause of a trend.
A true social-ecological indicator maps explicit causal interactions between ecological changes and human welfare. Without that causal link, you risk producing data that looks good in reports but does not guide real management decisions. This distinction matters enormously for your IB ESS internal assessment, where you are expected to explain not just what an indicator shows but why it changes and what that means for people and ecosystems together.
How are ecological indicators applied in education and conservation?
Monitoring indicator species illustrates biodiversity trends and ecosystem function in real-world learning, making them ideal tools for project-based environmental science education. You do not need a laboratory full of equipment to start. A quadrat survey measuring plant species diversity in a school field gives you a working biodiversity index within an afternoon.
Common applications in education and conservation include:
- Restoration monitoring: Tracking the return of native plant species after habitat restoration tells managers whether the intervention is working. Ecological indicators in restoration success assessment are now standard practice in conservation biology.
- Citizen science programs: Projects like the UK’s Butterfly Monitoring Scheme or the North American Breeding Bird Survey train volunteers to collect indicator data at national scale.
- IB ESS internal assessments: Students frequently use macroinvertebrate surveys, quadrat-based plant diversity counts, or water quality indices as their primary indicator data source.
- Digital tools: Apps like iNaturalist, GBIF data portals, and ODK Collect help students and researchers collect and analyze environmental indicator data in the field.
| Indicator type | Example | What it measures |
|---|---|---|
| Species richness index | Shannon Index | Overall biodiversity and evenness |
| Indicator species | Mayflies (Ephemeroptera) | Water quality and oxygen levels |
| Habitat condition score | Rapid Assessment Protocol | Structural integrity of a habitat |
| Ecosystem service proxy | Tree canopy cover | Carbon storage and urban cooling |
| Social-ecological indicator | Fish stock plus fisher income | Linked ecological and human welfare |
The role of indicators in ecology education is to make abstract concepts concrete. When a student watches a macroinvertebrate community shift after a pollution event, the concept of ecosystem sensitivity stops being a textbook definition and becomes something they have observed directly. That experience sticks.
Pro Tip: For your IB ESS IA, choose an indicator with a clear, documented sensitivity to one specific environmental variable. The cleaner the causal link, the stronger your analysis section will be.
Key takeaways
Measuring ecological indicators is the most practical way to track ecosystem health, support sustainability goals, and guide conservation decisions without exhaustive surveys.
| Point | Details |
|---|---|
| Indicators simplify complex data | A small set of well-chosen indicators reveals ecosystem trends faster and cheaper than full surveys. |
| Early-warning function | Indicator trends signal species decline and habitat loss before crises develop, enabling timely action. |
| Sustainability alignment | Ecosystem indicators are validated proxies for UN SDG 14 and SDG 15 targets, making them policy-relevant. |
| Goodhart’s Law risk | Treating indicators as targets rather than signals leads to symbolic compliance and missed ecological realities. |
| Education and practice | Indicator-based fieldwork, from macroinvertebrate surveys to iNaturalist data, builds real assessment skills. |
What I have learned from teaching ecological indicators
After more than a decade of working with IB ESS students, the single most common mistake I see is treating an ecological indicator as a fact rather than a signal. A student will report that the Shannon Index for their study site is 1.8 and stop there. That number means nothing without context: compared to what reference site, measured at what time of year, and in response to which stressor?
The second mistake is choosing an indicator because data is available rather than because it is the right tool for the question. Convenience-driven indicator selection is exactly the trap Goodhart’s Law describes. I always push students to start with the ecological question and work backward to the indicator, not the other way around.
What actually works in practice is tracking a minimal set of indicators consistently over time. Consistent long-term tracking is more valuable than any single metric’s choice. One well-monitored indicator measured every season for three years tells you far more than five indicators measured once. That principle applies equally to a national biodiversity monitoring program and a student IA.
My honest advice: treat ecological indicators the way a doctor treats a patient’s temperature. It is a useful signal, not a diagnosis. You still need to ask what is causing the reading and what the appropriate response is. That interpretive layer is where the real environmental science happens, and it is what separates a strong IB ESS response from a weak one.
— Marija
Esstutor can help you master ecological indicators for IB ESS
If ecological indicators feel tricky to apply in your internal assessment or exam answers, you are not alone. Many IB ESS students understand the concept in theory but struggle to connect it to their own data and analysis.
Esstutor offers personalized, one-on-one tutoring sessions designed specifically for IB ESS students worldwide. With over 13 years of experience as an IB examiner and educator, the tutoring covers everything from choosing the right indicator for your IA to writing the analysis and evaluation sections that examiners reward. Whether you need help with your IB ESS internal assessment or want to sharpen your exam technique, sessions are flexible and tailored to where you are right now. A trial lesson is available so you can see the approach before committing.
FAQ
What is an ecological indicator?
An ecological indicator is a measurable component of an ecosystem used to assess environmental conditions and track changes over time. Examples include indicator species, biodiversity indices like the Shannon Index, and water quality metrics like macroinvertebrate community scores.
Why are ecological indicators used instead of full ecosystem surveys?
Full ecosystem surveys are too costly and time-consuming for regular monitoring. A minimal, well-chosen set of indicators signals ecosystem trends effectively and allows early intervention before permanent damage occurs.
What is Goodhart’s Law and why does it matter for indicators?
Goodhart’s Law states that when a measure becomes a target, it ceases to be a good measure. In ecology, this means focusing only on easy-to-measure indicators while ignoring ecologically significant but harder-to-track processes.
How do ecological indicators support the UN Sustainable Development Goals?
Ecosystem condition indicators are validated proxies for regulating services like water purification and climate regulation, directly supporting SDG 14 (Life Below Water) and SDG 15 (Life on Land).
How can I use ecological indicators in my IB ESS internal assessment?
Choose an indicator with a clear, documented sensitivity to one specific environmental variable, such as macroinvertebrates for water quality or plant species richness for habitat condition. Then explain the causal link between your indicator and the environmental change you are investigating.
No Comments