


01 Aug Why Study Carbon Cycles: A Clear Guide for Students
TL;DR:
- Studying the carbon cycle is vital because it explains how carbon moves through Earth’s systems and influences climate and life. It helps predict climate change impacts, guides policy, and prepares students for environmental careers. Understanding the cycle’s reservoirs, fluxes, feedbacks, and human impacts enhances climate literacy and supports sustainable decision-making.
Studying the carbon cycle is essential because it explains how carbon moves through Earth’s systems and, in doing so, controls climate, supports all life, and shapes the decisions societies make about energy and land use. According to the U.S. Department of Energy, carbon dioxide as a greenhouse gas sits at the center of climate effects, making this one of the most policy-relevant topics you can study.
Here is what you will take away from this guide:
- Climate control: Carbon dioxide regulates Earth’s temperature; understanding its sources and sinks explains why the climate is changing.
- Life and food webs: Carbon is the chemical backbone of every living organism, so the cycle underpins all of ecology.
- Policy and mitigation: Governments use carbon budgets built on cycle data to design emissions targets and land-use policy.
- Student pathways: Mastering this topic prepares you for IB ESS exams, strong IA and EE projects, and careers in environmental science, policy, and research.
Table of Contents
- What is the carbon cycle and where is carbon stored?
- How do the key processes actually move carbon?
- How does the carbon cycle control Earth’s climate?
- Why does human activity make studying this cycle so urgent?
- Why should you, as a student, care about all of this?
- How does carbon cycle mastery help your IB ESS results?
- How has our understanding of the carbon cycle evolved over time?
- What tools do scientists use to study the carbon cycle?
- Where can you go deeper on the carbon cycle?
- Carbon cycle knowledge reaches far beyond climate science
- Key Takeaways
- A tutor’s perspective on why this topic changes how students think
- Esstutor helps you turn carbon cycle knowledge into IB ESS results
- Useful sources for further study
What is the carbon cycle and where is carbon stored?
The carbon cycle describes the continuous movement of carbon atoms between four major reservoirs: the atmosphere, the biosphere (living organisms and soils), the hydrosphere (oceans and freshwater), and the lithosphere (rocks, sediments, and fossil fuels). NOAA explains that because Earth is a closed system, the total amount of carbon never changes; only its location shifts.
Think of it like a bank account system. Each reservoir is an account holding a balance of carbon, and every biological or geological process is a transaction moving carbon between accounts. The atmosphere holds a relatively small balance but processes transactions fast. The lithosphere holds an enormous balance but moves carbon over millions of years.
Residence time is how long carbon stays in a reservoir before moving on. The atmosphere and surface ocean exchange carbon in days to years. Deep ocean sediments and rocks hold carbon for thousands to millions of years. This contrast is why burning fossil fuels is so disruptive: you are releasing carbon that took millions of years to accumulate, far faster than natural sinks can reabsorb it.
Pro Tip: When sketching the carbon cycle for class, label each reservoir with its approximate relative size (small/medium/large) and draw arrows for each flux. Add a timescale note next to each arrow: “seconds–years” for biological fluxes and “millions of years” for geological ones. That one extra label often earns you marks on diagram questions.
The GLOBE program’s carbon cycle framework formalizes this as pools and fluxes, a structure used in both education and professional carbon-budget research.
How do the key processes actually move carbon?
Processes are the verbs of the carbon cycle. Each one transfers carbon between reservoirs at a specific rate and in a specific direction.
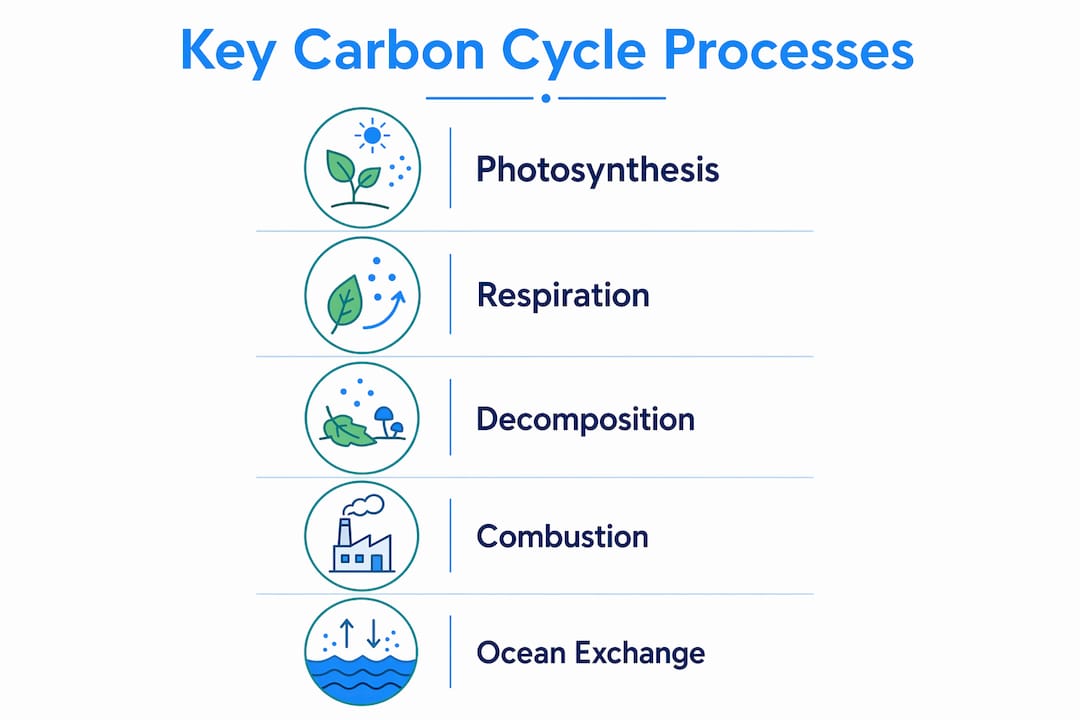
- Photosynthesis — Plants and algae absorb CO₂ from the atmosphere and convert it into organic carbon (sugars). This is the primary pathway pulling carbon out of the air.
- Cellular respiration — All living organisms break down organic carbon for energy, releasing CO₂ back to the atmosphere. It runs continuously, day and night.
- Decomposition — Bacteria and fungi break down dead organic matter, releasing CO₂ and methane. Slow decomposition in cold or waterlogged soils creates carbon-rich peat.
- Combustion — Burning organic material (wood, fossil fuels) rapidly oxidizes carbon to CO₂. Fossil fuel combustion is the dominant human-driven flux.
- Ocean exchange — CO₂ dissolves into surface seawater and is released back to the atmosphere depending on temperature and concentration gradients. Cold water absorbs more CO₂.
- Sedimentation and weathering — Over geological time, organic carbon is buried and compressed into fossil fuels; silicate rock weathering slowly draws CO₂ from the atmosphere.
To put these in perspective, NASA’s carbon cycle data shows that the fast biological cycle moves roughly 10¹⁶–10¹⁷ grams of carbon per year, human emissions run at about 10¹⁵ grams per year, and the slow geological cycle moves only 10¹³–10¹⁴ grams per year. Human emissions are therefore small compared to the biological cycle, but they are enormous compared to the geological processes that could permanently sequester that carbon.
| Process | Direction | Timescale |
|---|---|---|
| Photosynthesis | Atmosphere → Biosphere | Seconds to seasons |
| Respiration | Biosphere → Atmosphere | Continuous |
| Decomposition | Biosphere → Atmosphere/Soil | Days to centuries |
| Combustion | Biosphere/Lithosphere → Atmosphere | Instantaneous |
| Ocean exchange | Atmosphere ↔ Hydrosphere | Days to decades |
| Sedimentation | Biosphere → Lithosphere | Millions of years |

How does the carbon cycle control Earth’s climate?
Atmospheric CO₂ acts like a thermostat for Earth’s temperature. It absorbs outgoing infrared radiation and re-radiates it back toward the surface, a process known as the greenhouse effect. When carbon sinks (forests, oceans) absorb more than sources emit, CO₂ concentrations fall and the planet cools slightly. When sources outpace sinks, concentrations rise and warming follows.
The carbon budget captures this balance. Sources add carbon to the atmosphere; sinks remove it. Right now, the budget is out of balance because human activities have pushed sources well ahead of sinks.
Key figure: UC Berkeley’s climate data shows that human activities since the Industrial Revolution have driven atmospheric CO₂ from roughly 280 ppm (pre-industrial) to over 400 ppm in recent decades, a level not seen in at least 3.6 million years.
Ocean acidification is a direct consequence of this imbalance. When the ocean absorbs excess CO₂, it forms carbonic acid, lowering seawater pH. This threatens coral reefs and shell-forming organisms, which ripples through marine food webs. Understanding the climate impacts on ecosystems starts with understanding why CO₂ concentrations are rising in the first place.
Key points to keep in mind:
- Residence time determines how quickly a change in one reservoir affects others.
- Short-term climate change is driven by fast-cycle disruptions (fossil fuels, deforestation).
- Long-term recovery depends on slow geological sinks, which operate over timescales far beyond human planning horizons.
Why does human activity make studying this cycle so urgent?
Human perturbation of the carbon cycle is the defining environmental challenge of our time. Fossil fuel combustion and land-use change together have transferred massive quantities of carbon from slow geological reservoirs into the active atmosphere, faster than any natural sink can compensate.
Three feedbacks make this especially concerning:
- Permafrost thaw: Arctic permafrost stores vast amounts of frozen organic carbon. As temperatures rise, permafrost thaws, and microbial decomposition releases CO₂ and methane, amplifying warming further. This is a positive feedback loop with no natural “off switch” once it begins.
- Wildfire and vegetation dynamics: Warmer, drier conditions increase wildfire frequency, converting forests from carbon sinks to carbon sources. Burned areas may take decades to recover their sink capacity.
- Reduced ocean uptake: Warmer seawater holds less dissolved CO₂, meaning the ocean’s ability to buffer atmospheric concentrations weakens as the planet heats up.
The Royal Society’s analysis of carbon-climate feedbacks identifies these feedbacks as one of the largest sources of uncertainty in climate projections. Narrowing that uncertainty requires more research, more monitoring, and more students who understand the cycle deeply.
Then there is the “missing sink” problem. Known emissions exceed the carbon accounted for by measured sinks. Something is absorbing more carbon than scientists have fully explained, possibly regrowing forests or soil processes. This gap is an active research question and a genuinely accessible topic for student projects.
Satellite tools like MODIS and Landsat, combined with atmospheric measurements, are central to tracking these changes and narrowing the missing-sink uncertainty.
Why should you, as a student, care about all of this?
Understanding the carbon cycle opens real doors, both academically and professionally. Here is where that knowledge leads:
- Climate modeling: Carbon-cycle data feeds directly into the models that project future temperatures and sea levels.
- Environmental monitoring: Careers in remote sensing, field ecology, and atmospheric science all depend on carbon-flux measurement.
- Conservation and forestry: Managing forests as carbon sinks requires knowing how photosynthesis, decomposition, and disturbance interact.
- Policy design: Carbon taxes, cap-and-trade systems, and net-zero targets are all built on carbon-budget science.
- Sustainable agriculture: Soil carbon management is a growing field that links farming practice to climate outcomes.
Your daily choices are also literal carbon movements. The food you eat, how you travel, and how your home is heated all represent fluxes between reservoirs. NASA research highlights that teaching this personal link helps students connect individual behavior to system-level outcomes. For a practical way to measure your own impact, the carbon footprint guide for IB ESS is a strong starting point.
Pro Tip: For your IA or EE, consider quantifying a local carbon flux: a school energy audit, soil carbon measurements before and after land-use change, or local deforestation rates using freely available Landsat imagery. NOAA’s flux-focused guidance specifically recommends this approach for high-scoring assessments because it forces you to work with real data and acknowledge uncertainty.
How does carbon cycle mastery help your IB ESS results?
Carbon cycle knowledge maps directly onto IB ESS assessment objectives. You need to analyze systems, evaluate data and models, and discuss human impacts with evidence. The carbon cycle gives you a concrete system to practice all three.
Exam techniques that earn marks:
- Always distinguish between a source and a sink when answering data-response questions about CO₂ trends.
- Use residence time to explain why short-term mitigation (planting trees) differs from long-term sequestration (geological storage).
- When evaluating a model or graph, name specific feedbacks (permafrost, ocean uptake) rather than just saying “it gets worse.”
- Link flux magnitudes to human timescales: geological sinks cannot rescue us on a century timescale.
Strong IA and EE topic ideas:
- Investigating the “missing sink” using publicly available atmospheric CO₂ datasets from NOAA.
- Measuring soil carbon content across different land-use types near your school.
- Analyzing satellite-derived net primary productivity data to estimate local carbon uptake.
- Conducting a school energy audit and converting energy use to carbon flux estimates.
For structured guidance on building a high-scoring IA, the ESS IA examples library at Esstutor shows how strong students frame their research questions and handle data.
Marija, an IB examiner with over 13 years of experience, works with students specifically on carbon-cycle IA and EE projects through Esstutor. A trial session can help you identify the right research question and data sources before you commit to a topic.
How has our understanding of the carbon cycle evolved over time?
The carbon cycle was not always understood as a global system. In the 17th century, Jan Baptist van Helmont’s famous willow tree experiment showed that plant mass came largely from air and water, not soil, planting the seed for understanding photosynthesis. Joseph Priestley and Antoine Lavoisier later clarified the role of oxygen and carbon dioxide in combustion and respiration during the 18th century.
The 20th century brought the realization that the cycle operates at a planetary scale. Charles David Keeling’s continuous CO₂ measurements at Mauna Loa, begun in 1958, produced the iconic “Keeling Curve,” the first clear evidence that atmospheric CO₂ was rising steadily due to human activity. That dataset remains one of the most important in environmental science.
Since then, the field has expanded to include ocean carbon chemistry, permafrost dynamics, and satellite-based global monitoring, transforming the carbon cycle from a classroom concept into a live, data-rich research frontier.
What tools do scientists use to study the carbon cycle?
Modern carbon cycle research relies on a combination of methods, each suited to a different scale or reservoir.
Isotopic analysis uses the ratios of carbon isotopes (¹²C, ¹³C, ¹⁴C) to trace where carbon came from. Fossil fuel carbon lacks ¹⁴C because it is millions of years old, so rising atmospheric CO₂ with a declining ¹⁴C signature is direct evidence of fossil fuel origin.
Remote sensing satellites, including NASA’s MODIS and Landsat instruments, measure vegetation cover, fire extent, and land-use change across the entire planet. These datasets underpin global carbon budgets and are freely accessible for student projects.
Eddy covariance towers measure the net exchange of CO₂ between ecosystems and the atmosphere in near-real time. Networks like FLUXNET aggregate data from hundreds of sites worldwide.
Ocean monitoring buoys and Argo floats track dissolved CO₂ in surface and deep waters, helping scientists quantify how much the ocean is absorbing each year.
Carbon cycle models integrate all of these data streams to simulate past, present, and future carbon fluxes. The models used in IPCC assessments draw on all of the above.
Where can you go deeper on the carbon cycle?
A few well-chosen resources will take you from classroom basics to research-level understanding.
For conceptual grounding, the UC Berkeley Understanding Global Change page is clear, well-organized, and exam-appropriate. The GLOBE carbon cycle introduction is particularly useful for building the pools-and-fluxes mental model.
For data and monitoring, NOAA’s carbon cycle education resources link directly to atmospheric datasets and explain how to interpret them. NASA’s Earth Observatory carbon cycle pages pair readable explanations with satellite imagery.
For exam-level reading, the Royal Society’s carbon-climate feedbacks overview is the right level of depth for an EE literature review.
For interactive learning, Khan Academy’s science curriculum covers carbon cycle fundamentals with practice questions that complement IB ESS revision.
If you want to connect carbon cycle science to the bigger picture of why climate change matters, Esstutor’s student guides walk through the links clearly.
Carbon cycle knowledge reaches far beyond climate science
The carbon cycle is not just a climate topic. Its applications span multiple fields, and understanding it gives you a genuine advantage across disciplines.
Agriculture: Soil carbon management is central to sustainable farming. Practices like no-till farming and cover cropping increase soil organic carbon, improving fertility while sequestering CO₂. The USDA and agricultural universities actively research carbon farming as a mitigation strategy.
Forestry: Forest managers use carbon flux data to decide where to prioritize conservation versus harvest. Carbon credit markets pay landowners to maintain forests as sinks, creating direct economic incentives tied to cycle science.
Urban planning: Cities are measuring their carbon footprints and designing green infrastructure (urban forests, wetland restoration) to offset emissions. Planners need carbon-cycle literacy to evaluate these strategies honestly.
Public health: Air quality, wildfire smoke, and heat stress all connect to carbon-cycle disruptions. Epidemiologists and health planners increasingly work alongside climate scientists.
Policy making: Carbon taxes, emissions trading schemes, and international agreements like the Paris Agreement are all built on carbon-budget science. Policy analysts who understand the cycle can evaluate these mechanisms critically rather than accepting them at face value.
Key Takeaways
Studying the carbon cycle is the foundation for understanding climate change, ecosystem function, and the science behind every major environmental policy decision.
| Point | Details |
|---|---|
| Carbon moves through four reservoirs | Atmosphere, biosphere, hydrosphere, and lithosphere each hold and release carbon at different rates. |
| CO₂ has risen from ~280 ppm to over 400 ppm | This human-driven increase is the primary cause of modern climate change, per UC Berkeley’s data. |
| Feedbacks amplify the problem | Permafrost thaw and reduced ocean uptake can accelerate warming beyond what emissions alone predict. |
| The missing sink is an open research question | Known emissions exceed accounted-for uptake, making this an accessible and meaningful student project topic. |
| Esstutor supports IB ESS students | Personalized tutoring from an IB examiner helps students connect carbon-cycle science to high-scoring IA, EE, and exam responses. |
A tutor’s perspective on why this topic changes how students think
Students often arrive treating the carbon cycle as a list of processes to memorize. What shifts their understanding is realizing it is a system with feedbacks, not a flowchart. The moment a student grasps that burning fossil fuels bypasses the geological timescale and dumps millions of years of stored carbon into a fast cycle that cannot absorb it quickly, the urgency of climate science becomes self-evident rather than something they have to be told to care about.
The most common exam mistake I see is conflating sources and sinks without specifying timescale. A forest can be a sink on a decadal scale and a source after a wildfire. Teaching students to always qualify their claims with a timescale and a condition turns vague answers into precise ones, and precise answers earn marks.
My teaching tip: draw the cycle as a budget sheet in class. List every reservoir as an account, every process as a debit or credit, and ask students to find where the budget is currently out of balance. That exercise alone covers pools, fluxes, human impacts, and feedbacks in one sitting.
Esstutor helps you turn carbon cycle knowledge into IB ESS results
If you are working on an IB ESS internal assessment or extended essay on a carbon-related topic, one-on-one tutoring with an IB examiner makes a concrete difference. Esstutor offers personalized online sessions focused on exactly the skills this article covers: framing a research question around measurable fluxes, selecting the right data sources, and writing up results that meet IB assessment criteria.

Marija has over 13 years of experience as an IB examiner and ESS educator. She works with students on IA tutoring and exam preparation tailored to their specific topic and timeline. If your IA involves carbon flux data, soil carbon measurements, or a school energy audit, she can help you design the methodology and avoid the most common scoring pitfalls. You can also browse ESS extended essay support to see how Esstutor structures EE guidance from research question to final draft. Book a trial session to get started.
Useful sources for further study
- NOAA: What is the carbon cycle? — Clear overview of reservoirs, fluxes, and human impacts; ideal for exam-level reading and quick reference.
- NASA Earth Observatory: The Carbon Cycle — Covers flux magnitudes, satellite monitoring tools, and feedbacks; best for data context and IA background reading.
- U.S. Department of Energy: The Carbon Cycle — Authoritative explainer on CO₂ as a greenhouse gas; useful for policy-focused EE sections.
- UC Berkeley Understanding Global Change: Carbon Cycle — Excellent conceptual overview with the pre-industrial to modern CO₂ data; strong for exam preparation.
- GLOBE: Introduction to the Global Carbon Cycle — Best resource for understanding pools and fluxes as a budgeting framework; directly applicable to IA design.
- NOAA Education: Carbon Cycle Resources — Links to atmospheric datasets and guidance on flux-focused analysis for student projects.
- Royal Society: Carbon-Climate Feedbacks — Research-level overview of feedbacks and projection uncertainty; appropriate for EE literature reviews.
- Biology LibreTexts: Carbon Cycle — Clear explanation of fast vs. slow cycle timescales; useful for understanding why geological sinks cannot offset rapid emissions.
No Comments