


29 Apr Step-by-step guide to excelling in your IB ESS IA
TL;DR:
- The IB ESS Internal Assessment is a valuable, manageable project with proper planning and focus.
- Choosing a specific, local, and measurable research question is crucial for success.
- Emphasizing evaluation, clear methodology, and real-world application distinguishes high-scoring IAs.
The IB ESS Internal Assessment can feel like a mountain when you first look at the criteria, the word count, and the need to collect real environmental data. Many students spend weeks feeling stuck before they even write a single line. But here is the truth: with a clear plan and the right focus, the ESS IA is one of the most rewarding assessments in the entire Diploma Programme. It counts for 25% of your final grade, which means getting it right has a real impact on your score. This guide walks you through every stage, from choosing your topic to writing your final reflection, so you can approach your IA with confidence.
Table of Contents
- Understand the structure and assessment criteria
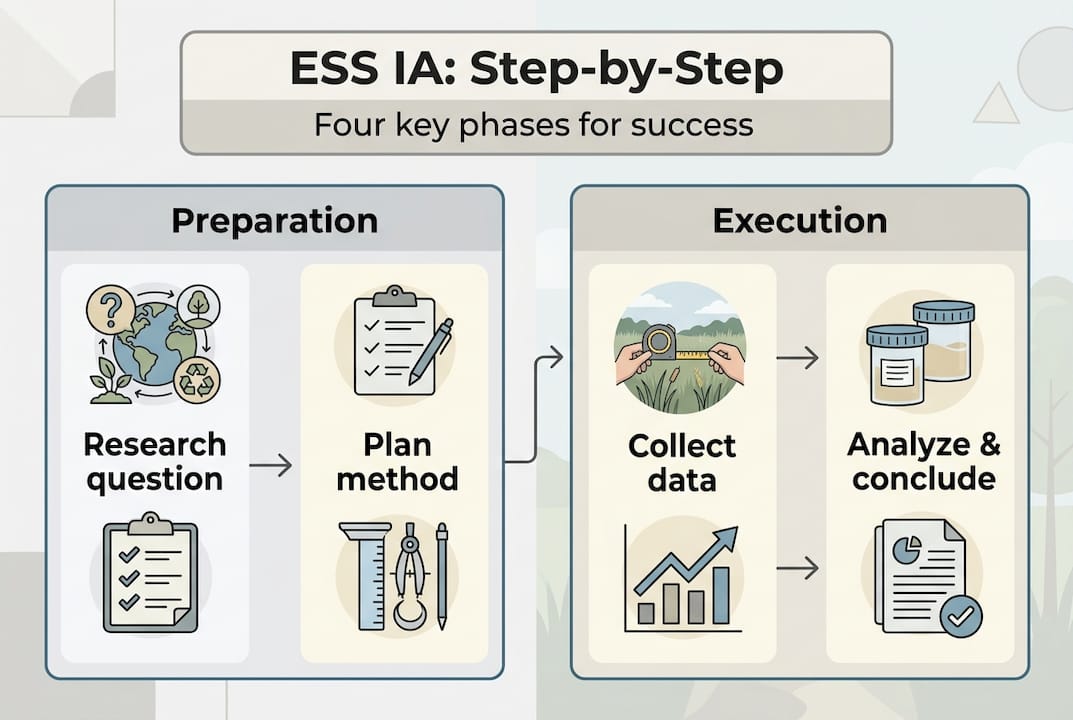
- Step 1: Choose a research question and context
- Step 2: Plan your methodology and data collection
- Step 3: Collect, process, and analyze your data
- Step 4: Evaluate, conclude, and apply your findings
- What most students miss: A practical insider perspective
- Get expert support for your ESS internal assessment
- Frequently asked questions
Key Takeaways
| Point | Details |
|---|---|
| Follow the marking scheme | Each IA section is graded against well-defined criteria, so tailor your work to maximize points. |
| Choose a focused question | Select a measurable, local research question to make your data collection and analysis easier. |
| Plan and pilot your methods | Test your investigation process first to avoid mistakes and ensure high-quality primary data. |
| Analyze and evaluate rigorously | Use appropriate statistics and provide thorough evaluation to distinguish your work. |
| Connect science and society | Relate your findings to larger environmental and social contexts for higher marks. |
Understand the structure and assessment criteria
Before you write a single word, you need to know exactly what examiners are looking for. The IBO’s ESS curriculum outlines the IA as a scientific investigation, and understanding its structure is your first advantage over students who jump straight into fieldwork without reading the mark scheme.
The ESS IA is marked out of 24 points across five criteria. Here is how those marks break down:
| Criterion | Focus | Marks |
|---|---|---|
| A: Research design | Research question, methodology | 6 |
| B: Data collection and processing | Recording, tables, graphs | 6 |
| C: Analysis and conclusion | Trends, links to ESS concepts | 4 |
| D: Evaluation | Limitations, errors, improvements | 6 |
| E: Communication | Structure, referencing, clarity | 2 |
That table should tell you something important right away. Criterion D (Evaluation) carries 6 marks, the same as Criterion A and B. Students who treat evaluation as an afterthought leave a huge number of marks on the table. The step-by-step IA guide at EssTutor.net breaks down each criterion in even more detail, which is worth bookmarking now.
Here is what successful IAs consistently have in common:
- A narrow, focused research question tied to a local environmental issue
- Primary data collected through a clearly justified methodology
- Use of systems thinking to connect findings to broader ESS concepts
- Statistical processing that goes beyond simple averages
- Evaluation that addresses specific, named limitations with realistic improvements
- Clear, numbered, and captioned figures and tables
One of the biggest mistakes students make is choosing a topic that is too broad or too global. When you focus locally, whether that means a nearby stream, a school garden, or a local park, you can collect meaningful primary data, which is essential for scoring a 7 in ESS IA. Examiners want to see that you have done real fieldwork, not just summarized what other people found. Browse IA topic ideas if you need inspiration before moving forward.
With the foundational knowledge set, it is time to move to the first step: choosing the right research question.
Step 1: Choose a research question and context
Your research question is the backbone of your entire IA. If it is vague, too big, or impossible to test with local data, everything else suffers. A great question is specific, measurable, and connected directly to an ESS concept such as biodiversity, soil quality, pollution, or ecosystem services.
Here are a few examples of strong, IB-style research questions:
- “How does distance from a main road affect the species diversity of lichen on tree bark in [local park name]?”
- “What is the effect of pH levels on macroinvertebrate species richness in [local river name]?”
- “How does the percentage of impermeable surface cover affect runoff rates across different land-use zones in [local area]?”
Notice that each question names a specific, measurable independent variable, a clear dependent variable, and a local context. That combination is what makes a question workable. For more inspiration, check out these interesting topic ideas drawn from real student investigations.
A strong research question should meet all of these criteria:
- Measurable: You can collect numerical or categorical data to answer it
- Specific: It focuses on one clear relationship between variables
- Feasible: You can realistically collect the data within your school’s timeframe and with available equipment
- Locally grounded: It connects to an environmental issue in your community or region
- ESS-linked: It ties to at least one concept from the ESS syllabus
Prioritizing local, accessible issues for primary data collection is the most reliable way to score strongly in Criterion C and D, because you have direct control over your investigation and can speak confidently about your methodology.
Pro Tip: Once you have a draft question, read it aloud and ask yourself: “Could I explain exactly how I would answer this question in five steps?” If you cannot, it is probably still too vague. Also look at outstanding IA examples to see what high-scoring questions look and feel like in practice.
Once you have a solid question and context, the next phase is planning your methodology in detail.
Step 2: Plan your methodology and data collection
A well-planned methodology is what separates students who collect useful data from those who get to the field and realize they forgot to control for a key variable. Examiners in Criterion A look for evidence that you thought carefully about your design before you started collecting anything.
Follow these numbered steps when planning your methodology:
- Identify your variables: State your independent variable (what you change), your dependent variable (what you measure), and your controlled variables (what you keep the same to ensure a fair test).
- Decide on sample size and sampling strategy: A sample size of 30 or more data points is generally recommended for statistical tests. Decide whether random, systematic, or stratified sampling best suits your question.
- List your equipment and materials: Be specific. Saying “a water testing kit” is weaker than naming the exact brand and parameter being tested (e.g., a Hanna HI98130 meter for electrical conductivity).
- Conduct a pilot run: Before formal data collection, carry out a small trial. This helps you spot logistical issues, refine your technique, and estimate how long each measurement takes.
- Identify risks and ethical considerations: Consider personal safety in the field, the impact of your investigation on the environment (for example, avoiding disturbance to wildlife), and data privacy if any human subjects are involved.
Here is a quick reference table for common ESS investigation types:
| Investigation type | Common tools | Data type |
|---|---|---|
| Water quality | pH meter, turbidity tube, DO meter | Quantitative |
| Biodiversity | Quadrats, pitfall traps, ID guides | Quantitative/qualitative |
| Soil analysis | Soil probe, pH paper, moisture meter | Quantitative |
| Noise/light pollution | Decibel meter, lux meter | Quantitative |
| Carbon footprint | Surveys, emission calculators | Quantitative/qualitative |
The step-by-step planning process outlined above reflects what examiners expect to see in a high-scoring Criterion A. See how this fits into organizing your IA from the very beginning.
Pro Tip: Run your pilot test at least two weeks before your planned data collection date. That gives you time to adjust your method, source different equipment, or refine your sampling locations without rushing.
With your methodology outlined, it is time to carry out accurate data collection and processing.

Step 3: Collect, process, and analyze your data
Collecting data is where your planning pays off. Use a pre-designed data table in your field notebook or on a tablet so that you record every measurement in real time, not from memory later. Consistent recording habits prevent errors that are hard to explain during evaluation.
Follow these steps for processing your data effectively:
- Calculate descriptive statistics: Find the mean and standard deviation for each group or sampling location. Standard deviation tells examiners how much variation exists in your data, which matters for conclusions.
- Create clear, labeled graphs: Choose the right graph type. Bar charts work well for comparing categories; scatter plots are better for showing relationships between two continuous variables.
- Build organized data tables: Every table needs a number, a descriptive title, and units in the column headers. Never leave examiners guessing what a column represents.
- Identify trends: Write one or two sentences describing what the graph shows before you explain why. Examiners want to see that you can read your own data clearly.
- Apply statistical tests where appropriate: A Spearman’s rank correlation works well for environmental data that may not be normally distributed. A T-test helps you compare two groups (e.g., pH values upstream versus downstream).
Process your data with statistics (mean, SD), graphs, and tables, and always connect trends directly back to your research question and relevant ESS concepts for maximum marks in Criterion C.
Using stats like correlation or T-test in your analysis adds the analytical depth that examiners reward at the top of the mark bands. Many students skip this step entirely, which keeps their Criterion C score low. For a full breakdown of how analysis links to your overall score, see these 7-point scoring strategies.
Pro Tip: Number every single graph and table (e.g., Figure 1, Table 2) and include a caption beneath each one that describes what it shows. This simple habit improves your Criterion E communication score and makes your IA much easier to read.
Having analyzed your data, the next key step is evaluation, which often separates an average IA from an excellent one.
Step 4: Evaluate, conclude, and apply your findings
The evaluation section is where many students lose marks they could easily have kept. Criterion D carries 6 marks, and most students write two or three generic sentences about “human error” and call it done. That approach will not get you past the middle mark band.
A strong evaluation includes all of the following:
- Specific limitations: Name the actual constraint (e.g., “Data was collected over only one week in March, which may not reflect seasonal variation in macroinvertebrate populations.”)
- Systematic and random errors: Identify where your measurements may have been consistently off (systematic) or randomly variable (random), and explain why.
- Realistic improvements: Suggest practical changes, not just “collect more data.” For example, “Using a flow meter rather than timed ping-pong balls would reduce measurement error in stream velocity by standardizing technique.”
- Uncertainties: Acknowledge where your conclusions have limits based on sample size, equipment precision, or environmental conditions.
Evaluation at Criterion D separates high from low scores. Named, specific limitations with practical improvements consistently score at the top band, while generic statements score at the bottom.
Your conclusion should be one clear paragraph that directly answers your research question using evidence from your data. Avoid vague language. Instead of “the results showed a relationship,” write “species richness decreased significantly (r = 0.78, p < 0.05) with increasing proximity to the road, suggesting that vehicle emissions or mechanical disturbance negatively affect lichen diversity.”
Use the systems approach by linking your findings to ESS unifying concepts (systems, sustainability, perspectives) for Criterion E. A conclusion that connects local data to broader environmental management or policy is what earns top marks.
Finally, connect your findings to real-world applications. How could your results inform local environmental management? What societal perspective does your data support or challenge? This is where ESS truly stands apart from standard biology or chemistry IAs. See the full range of strategies for improving your IA score if you want to strengthen this section before submission.
Now that you understand the step-by-step process, let us look at what most guides miss and what truly elevates an ESS IA.
What most students miss: A practical insider perspective
After working with IB ESS students for over 13 years, I have seen the same patterns again and again. Students who score in the 20 to 24 range do not necessarily have the most impressive data. They have the clearest thinking and the most honest evaluation.
Here is what the top scorers do differently. They use a criteria checklist before submitting every draft, literally going through each mark band descriptor and asking “do I have evidence for this?” They also get peer feedback specifically on clarity, not just content. If a classmate cannot understand what your research question is asking, an examiner will have the same problem.
One area where I see students lose marks consistently is the societal and environmental application in Criterion E. Students focus so hard on the science that they forget to connect their data to real management decisions or environmental perspectives. ESS is not just ecology; it is the intersection of systems, society, and sustainability. Reflect that in your writing.
Referencing also matters more than students expect. Consistent workflow tips and clear APA or MLA citation formatting throughout your IA demonstrate academic integrity and push your Criterion E score to its maximum.
Pro Tip: Do not treat the IA as a one-draft document. Plan for at least three revision cycles: one for structure, one for depth of analysis, and one for clarity and referencing.
Get expert support for your ESS internal assessment
Knowing the steps is one thing. Executing them under time pressure with a strong final product is another. That is where personalized support makes a real difference.
At EssTutor.net, I work one-on-one with students at every stage of their IA, from refining research questions to reviewing final drafts. You can work with an experienced ESS IA tutor who has spent over 13 years as an IB examiner and educator. You will also get access to real IA examples from high-scoring students, plus a full range of study resources including ESS notes and textbooks. Book a trial lesson today and take the next step toward a score you are proud of.
Frequently asked questions
How many words should my IB ESS Internal Assessment be?
Aim for about 2,250 to 3,000 words, as this range gives you enough space to address all five criteria thoroughly without padding with unnecessary content.
Do I have to collect primary data for my IA?
Primary data is essential, though secondary data can be accepted in specific circumstances where primary collection is genuinely not feasible, as long as you clearly justify the choice.
What are the most important criteria for scoring high on the ESS IA?
Strong, specific evaluation of limitations, a well-justified methodology, systems thinking in your conclusion, and direct application to real-world environmental issues are the factors that separate high from low scores at Criterion D and beyond.
Can I use a global issue for my IA topic?
Local issues score higher than purely global ones because they allow for genuine primary data collection, but a globally framed topic can work if you give it a specific local angle and collect original data to support your investigation.
What referencing style should I use for my ESS IA?
Use consistent APA or MLA formatting throughout your IA, ensuring all figures are numbered and captioned and all sources are cited both in-text and in a reference list at the end.
No Comments