

19 Jun Role of Carbon Footprint in ESS: IB Student Guide
TL;DR:
- A carbon footprint measures the total greenhouse gas emissions caused by an individual, organization, or activity in CO2e. It connects to the carbon cycle by quantifying human contributions that disrupt natural sinks and accelerate climate change. This metric guides sustainability efforts, but it must be complemented by other indicators because it cannot predict all environmental impacts.
A carbon footprint is defined as the total greenhouse gas emissions produced by an individual, organization, or activity, expressed in carbon dioxide equivalent (CO2e), and it serves as a foundational metric in Environmental Systems and Societies (ESS) for measuring human impact on climate change. In IB ESS, understanding the role of carbon footprint means learning how human actions translate into measurable environmental pressure. This guide covers how carbon footprints are calculated, where they fall short as a standalone indicator, how they connect to the carbon cycle, and what they mean for real sustainability decisions. Whether you are preparing for an exam or working on your internal assessment, this topic shows up everywhere in ESS.
What is the role of carbon footprint in ESS?
Carbon footprint in ESS is the primary tool for quantifying how much greenhouse gas a person, school, product, or system releases into the atmosphere. It captures both direct emissions (Scope 1), such as burning fuel in a school boiler, and indirect emissions (Scope 2 and Scope 3), such as the electricity a campus buys or the food served in its cafeteria.

In IB ESS, carbon footprint analysis connects to several core themes: ecological systems, human populations, resource use, and climate change. It gives students a concrete, numerical way to evaluate environmental impact rather than relying on vague descriptions. When you can say that a Southern Indian university produced 2.52 t CO2 eq. per capita in 2024, you have a specific, comparable data point to work with.
The importance of carbon footprint in ESS also lies in its policy relevance. Governments, schools, and companies use carbon data to set targets and track progress. For ESS students, learning to read and interpret that data is a skill that transfers directly to exam questions, internal assessments, and real environmental decision-making. You can explore how this connects to broader sustainability principles in Esstutor’s guide on what sustainability means in ESS.
How is a carbon footprint calculated in ESS?
Carbon footprint calculations in ESS rely on identifying emission sources across three scopes and then converting them into CO2e using established emission factors.
- Scope 1: Direct emissions from sources owned or controlled by the entity, such as gas heating or diesel generators.
- Scope 2: Indirect emissions from purchased electricity or heat.
- Scope 3: All other indirect emissions, including supply chains, food services, and staff commuting.
- Scope 4 (avoided emissions): A newer category that accounts for carbon sequestration, such as trees on a campus absorbing CO2.
For institutions like universities, researchers now recommend hybrid LCA-EEIOA methodologies that combine life cycle assessment (LCA) with environmentally extended input-output analysis (EEIOA). This approach captures emissions that a simple energy audit would miss entirely, including embedded carbon in purchased goods and services.
A real-world example makes this concrete. A study of Necmettin Erbakan University found that installing a 1,000 kVA photovoltaic (PV) system reduced campus carbon footprint by about 33%. Adding a battery energy storage system (ESS) on top of that dropped emissions by over 90%. That is a dramatic result, and it shows why energy source choices matter so much in carbon footprint analysis.
One detail that surprises many students: in battery energy storage system manufacturing, over 40% of total carbon emissions come from cathode and anode chemical cleaning processes, not from raw material extraction. This means the carbon cost of “green” technology is more complex than it first appears.
Pro Tip: When you write an ESS internal assessment involving carbon footprint data, always state which scopes your calculation includes. Examiners notice when students treat Scope 1 as the whole picture.
What are the limitations of carbon footprint as a sole indicator?
Carbon footprint is a useful metric, but it does not tell the full environmental story. Research analyzing approximately 4,000 products found that carbon footprint poorly predicts 16 other major environmental impact categories, including ozone depletion, acidification, eutrophication, and various forms of toxicity. That finding matters a great deal for ESS students who are trained to think in systems.
Here is a comparison that puts this in perspective:
| Environmental impact | Captured by carbon footprint? | Requires additional indicator? |
|---|---|---|
| Climate change (CO2e) | Yes | No |
| Ozone depletion | No | Yes (ODP metric) |
| Freshwater acidification | No | Yes (AP metric) |
| Eutrophication | No | Yes (EP metric) |
| Human toxicity | No | Yes (HTP metric) |
A product with a low carbon footprint can still cause serious harm through toxic chemical release or water pollution. Relying on carbon footprint alone can lead to decisions that look good on paper but shift environmental damage from one category to another.
For ESS students, this means you should treat carbon footprint as one layer of analysis, not the final word. The ecological footprint concept in ESS adds another layer by accounting for land use and biocapacity. Together, these tools give a more complete picture of human environmental pressure.
Pro Tip: In ESS exam questions that ask you to “evaluate” carbon footprint as an indicator, always include at least one specific limitation with a named alternative metric. That earns the higher command term marks.
What is the relationship between the carbon cycle and carbon footprint in ESS?
The carbon cycle is Earth’s natural system for moving carbon between the atmosphere, oceans, soils, and living organisms. Carbon footprint quantifies how much human activity disrupts that cycle by adding CO2 and other greenhouse gases faster than natural sinks can absorb them.
Here is how the two concepts connect in ESS:
- Natural carbon sinks (forests, oceans, soils) absorb carbon from the atmosphere and keep the cycle in balance.
- Human carbon emissions from fossil fuels, deforestation, and agriculture add carbon to the atmosphere at rates that exceed sink capacity.
- This imbalance triggers climate feedback loops such as permafrost thaw releasing stored methane, which accelerates warming further.
- Carbon footprint measurement quantifies the human-driven flux that pushes the cycle out of equilibrium.
- Reducing a carbon footprint means reducing the rate at which humans add carbon to a cycle that is already under stress.
One finding from the Southern Indian university study illustrates the limits of natural offsets: campus greenery offset only 1.53% of total emissions. That number should reshape how you think about tree-planting as a climate solution. Trees help, but they cannot compensate for large-scale institutional emissions without dramatic reductions at the source.
Understanding the role of the carbon cycle in ESS means recognizing that carbon footprint is not just an accounting exercise. It is a measure of how far human systems have pushed a natural cycle beyond its recovery capacity.
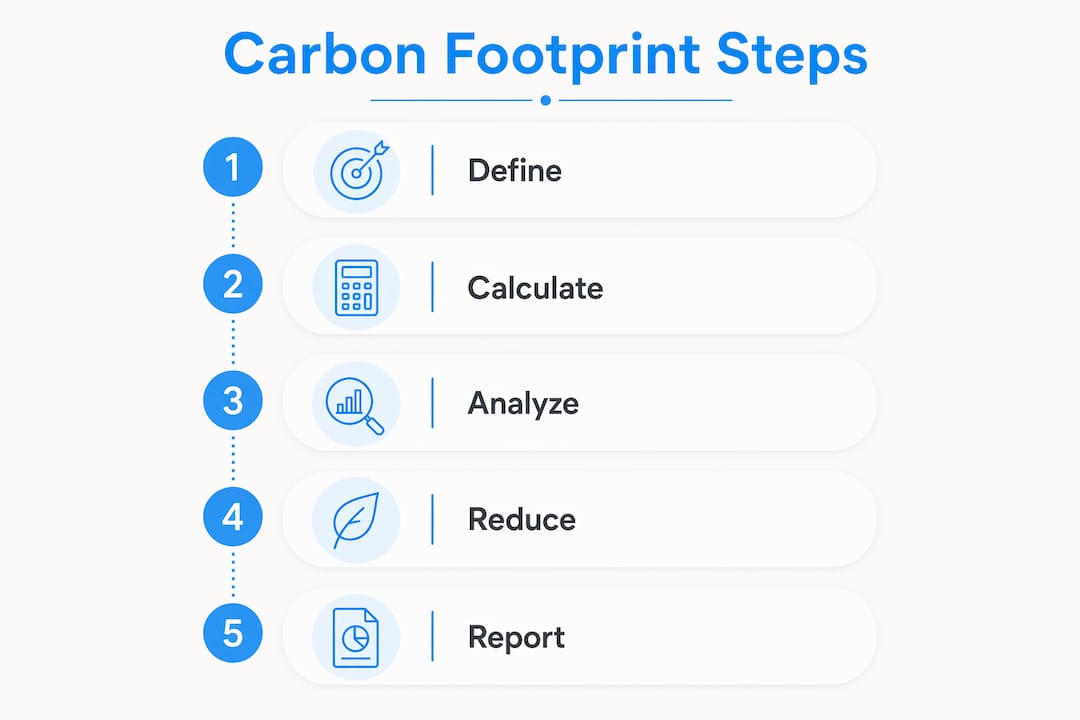
How can carbon footprint data guide sustainability actions in ESS?
Carbon footprint data is most valuable when it drives specific decisions, not when it sits in a report. Accurate emissions measurement is the foundation of credible climate action. Without it, reduction efforts remain scattered and impossible to verify.
Here is a practical framework for using carbon footprint analysis in ESS contexts:
- Identify the largest emission sources first. At the Southern Indian university, electricity, food services, and IT equipment were the top contributors. Targeting those three areas delivers far more impact than general awareness campaigns.
- Set a measurable baseline. A baseline carbon footprint gives you a reference point. Every subsequent measurement tells you whether actions are working.
- Prioritize energy source changes. The Necmettin Erbakan University case showed that combining PV systems with energy storage cut emissions by over 90%. Switching energy sources produces larger reductions than behavioral changes alone.
- Account for lifecycle emissions in purchasing decisions. A battery with a 6,000-cycle lifespan effectively halves carbon intensity per kWh compared to shorter-lived alternatives. Durability is a carbon strategy.
- Track and report progress transparently. Measurement without reporting creates no accountability. Schools and institutions that publish annual carbon data create pressure to improve year over year.
For ESS students, this framework applies directly to internal assessments. If your IA involves carbon footprint analysis, structuring your investigation around these five steps gives your methodology a clear, defensible logic. You can also connect your findings to environmental stewardship principles that the IB ESS curriculum emphasizes.
The broader lesson is that carbon footprint data transforms abstract concern about climate change into specific, prioritized action. That is exactly the kind of thinking IB ESS rewards in both exams and assessments.
Key Takeaways
Carbon footprint in ESS is a measurable, CO2e-based indicator of human environmental impact, most powerful when combined with other metrics, grounded in carbon cycle science, and used to drive specific, evidence-based sustainability decisions.
| Point | Details |
|---|---|
| Carbon footprint defined | Total greenhouse gas emissions expressed as CO2e, covering Scope 1, 2, and 3 sources. |
| Calculation methods matter | Hybrid LCA-EEIOA approaches capture institutional emissions that simple energy audits miss. |
| Limitations are real | Carbon footprint does not reliably predict 16 other impact categories, including toxicity and acidification. |
| Carbon cycle connection | Human emissions disrupt natural carbon sinks and trigger feedback loops that worsen warming. |
| Data drives action | Identifying top emission sources and switching energy systems produces the largest measurable reductions. |
Why carbon footprint is both a strength and a trap in ESS education
I have worked with IB ESS students for over 13 years, and carbon footprint is one of those topics that students either oversimplify or overcomplicate. The oversimplification goes like this: “lower carbon footprint equals better environmental performance.” The overcomplication looks like paralysis in front of a methodology section because the student does not know which scopes to include.
The truth sits between those two positions. Carbon footprint is genuinely powerful as a learning tool because it forces students to trace cause and effect across systems. When a student realizes that the food served in a school cafeteria contributes more to the institution’s carbon footprint than its heating system, that is a real systems-thinking moment. It changes how they see consumption.
But I also push students to treat carbon footprint critically. The research showing it fails to predict ozone depletion, toxicity, and acidification is not a footnote. It is a core ESS lesson about the danger of single-metric thinking. The IB ESS curriculum asks students to think holistically, and carbon footprint alone does not satisfy that standard. Building environmental literacy means knowing when a metric is useful and when it is incomplete.
My advice: use carbon footprint as your entry point into environmental impact analysis, not your exit point.
— Marija
Strengthen your ESS understanding with Esstutor
If carbon footprint analysis, carbon cycle dynamics, and sustainability frameworks feel like a lot to hold together, you are not alone. These topics connect across multiple ESS units, and exam questions often ask you to apply them in unfamiliar contexts.

Esstutor offers personalized, one-on-one tutoring for IB ESS students worldwide, led by an IB examiner with over 13 years of experience. Sessions cover everything from foundational concepts like carbon footprint to full IB ESS course content, internal assessment support, and exam technique. Whether you need help structuring your IA methodology or understanding how to evaluate environmental indicators critically, Esstutor tailors every session to where you are right now. Book a trial lesson and see the difference targeted support makes.
FAQ
What does carbon footprint mean in ESS?
Carbon footprint in ESS is the total greenhouse gas emissions produced by an individual, institution, or activity, expressed in CO2e. It measures human contribution to climate change across direct and indirect emission sources.
How does carbon footprint relate to the carbon cycle in ESS?
Human carbon emissions add CO2 to the atmosphere faster than natural sinks can absorb it, disrupting the carbon cycle and triggering climate feedback loops. Carbon footprint quantifies the scale of that disruption.
Why is carbon footprint not enough as a sole environmental indicator?
Research on approximately 4,000 products shows carbon footprint does not reliably predict impacts like ozone depletion, acidification, or toxicity. ESS students should use it alongside other indicators such as ecological footprint and acidification potential.
How can a school or university reduce its carbon footprint?
Switching to renewable energy sources like photovoltaic systems combined with energy storage produces the largest reductions. One university study found this combination cut campus emissions by over 90%.
Is carbon footprint relevant for IB ESS internal assessments?
Carbon footprint analysis is a strong IA topic because it involves measurable data, clear methodology, and direct links to ESS sustainability concepts. Always specify which emission scopes your investigation covers to strengthen your methodology section.
No Comments