

05 Jun ESS Practical Report Guide for IB Students
TL;DR:
- An ESS practical report is a structured scientific document that must meet IB criteria, showcasing an inquiry-based investigation. It requires precise organization, including a clear research question, reproducible methodology, organized data, and critical evaluation linking findings to ESS concepts and real-world issues. Adhering to these standards and avoiding common mistakes will maximize the report’s quality and scoring potential.
An ESS practical report is a structured scientific document that communicates an inquiry-based investigation clearly and concisely to meet IB assessment standards. In IB Environmental Systems and Societies, this type of report is formally called an Internal Assessment (IA), and it counts toward your final grade. Getting the structure right is not optional. The 3,000-word limit is strict, and every section must serve a specific purpose aligned with IB criteria. This ESS practical report guide walks you through each component, from your research question to your conclusion, so you can write with confidence and precision.
What are the essential components of an ESS practical report?

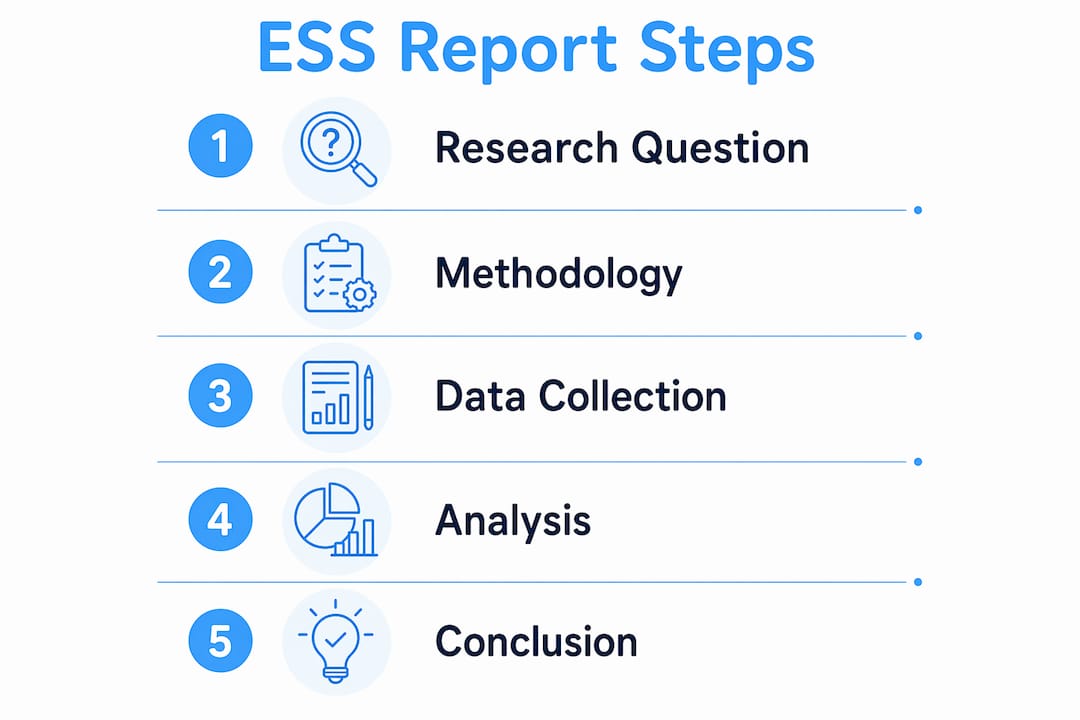
The IB ESS IA follows a standard scientific report structure, but each section carries specific expectations tied to the IB rubric. Knowing what goes where saves you from losing marks on technicalities. Here is how the sections break down and what each one needs to accomplish.
| Report section | IB expectation |
|---|---|
| Background and context | Briefly introduce the environmental topic and justify why the investigation matters |
| Research question (RQ) | One clear, testable question identifying independent and dependent variables |
| Variables | List independent, dependent, and at least three control variables with units |
| Methodology | Reproducible, step-by-step method written in passive voice with quantities and calibration details |
| Raw data | Organized tables with units, repeated trials, and uncertainty values |
| Processed data and analysis | Calculations, averages, graphs, and interpretation of patterns |
| Evaluation | Discussion of limitations, reliability, and realistic improvements |
| Conclusion | Direct answer to the RQ linked to ESS concepts and broader environmental implications |
| Safety, ethics, and references | Required for IB compliance; often underweighted by students |
The inquiry-based approach is central to IB ESS, which means your report must show that you designed and carried out the investigation yourself, not just followed a recipe. Each section should demonstrate a skill: the methodology shows planning, the analysis shows interpretation, and the evaluation shows critical thinking.
Pro Tip: Write your background and introduction after you have finished your analysis. This way, your introduction accurately frames what you actually found, rather than what you expected to find.
How to develop a focused research question and plan your methodology
A strong research question is the foundation of a high-scoring ESS report. Without a clear RQ, your methodology lacks direction and your analysis has nothing to answer. The IB rewards specificity, so vague questions like “How does pollution affect ecosystems?” will cost you marks.
A well-formed ESS research question has three qualities:
- It names the independent variable clearly. For example: “How does the concentration of nitrates (0, 10, 20, 30, 40 mg/L) affect the growth rate of Lemna minor over 14 days?”
- It identifies the dependent variable with a measurable unit. Growth rate measured in frond count per day is specific and quantifiable.
- It controls for realistic variables. Light intensity, temperature, and pH are all controllable in a school lab or field setting.
Once your RQ is set, your methodology must be detailed enough that another student could replicate your experiment exactly. Reproducibility of methods is foundational to trust in scientific reports, and IB examiners check for this directly. Include exact quantities, equipment specifications, calibration steps, and the number of repeated trials. Three trials per data point is the standard minimum for ESS investigations.
Planning your methodology also means thinking about ESS-specific ethical and environmental considerations. If you are collecting soil or water samples from a natural site, note how you minimized disturbance. If your investigation involves living organisms, document how you handled and disposed of them responsibly. These details belong in your methodology and show the examiner that you understand the broader implications of scientific work.
Pro Tip: Document calibration steps for every instrument you use, including pH meters, light sensors, and balances. A single sentence like “The pH meter was calibrated using buffer solutions of pH 4 and pH 7 before each trial” can significantly strengthen your evaluation section later.
How to collect, organize, and present data in your ESS report
Data presentation is where many students lose marks they have already earned through good experimental work. Raw data must appear in clearly labeled tables with units in every column header. If you ran three trials, show all three. Do not average before the raw data table.
Your processed data table comes next and should show:
- Calculated averages for each data point
- Uncertainty values or ranges (for example, ±0.1°C for a thermometer)
- Any derived values such as percentage change or growth rate
Tables should include raw data and processed calculations with uncertainties, and software tools like Microsoft Excel, Google Sheets, or Logger Pro can help you produce clean, professional graphs. Bar charts work well for categorical comparisons, while line graphs suit continuous variables measured over time. Every graph needs a descriptive title, labeled axes with units, and a caption explaining what it shows.
One mistake students make is presenting data without connecting it to their analysis. Each table or graph should be referenced in your written analysis. Write “As shown in Figure 2, nitrate concentration above 30 mg/L caused a decline in frond count,” not just “See Figure 2.” The data alone does not speak for itself. Your job is to interpret it.
For investigations involving species diversity, you might use the Simpson’s Diversity Index or Shannon-Wiener Index. For water quality studies, statistical comparisons between sites add depth. The use of statistical analysis tools like ANOVA is appropriate when comparing means across multiple groups, and including one demonstrates a higher level of analytical thinking.
How to analyze results, evaluate limitations, and write a strong conclusion
This section is where your report either earns top marks or falls short. Many students describe their data well but fail to interpret it deeply. Analysis and results are not the same thing, and keeping them clearly separated strengthens your scientific argument.
Follow this sequence for your analysis and discussion:
- State the pattern. Describe what your data shows without interpretation. “Frond count increased from an average of 12 to 47 over 14 days at 10 mg/L nitrate concentration.”
- Interpret the pattern. Explain why this happened using ESS theory. “This increase is consistent with the role of nitrates as a limiting nutrient in aquatic primary productivity.”
- Identify anomalies. Note any data points that do not fit the trend and suggest reasons. “Trial 2 at 40 mg/L showed an unexpected increase, possibly due to contamination during sample preparation.”
- Link to ESS systems. Connect your findings to broader concepts like eutrophication, nutrient cycles, or ecosystem services. This is where ESS reports differ from standard biology lab reports.
- Evaluate your methodology. Discuss at least three specific limitations, their likely impact on your results, and realistic improvements. Vague statements like “human error could have affected results” score zero. Instead, write: “Inconsistent light exposure between trials due to the lab’s east-facing windows may have inflated growth rates in morning trials. Using a growth chamber with controlled lighting would eliminate this variable.”
Strong evaluation requires planned uncertainty measurement such as repeat trials and calibration checks. If you planned these from the start, your evaluation writes itself. If you did not, you will struggle to discuss reliability credibly.
Your conclusion should be one focused paragraph. Answer your RQ directly, state whether your hypothesis was supported, and connect your findings to an ESS concept or real-world environmental issue. For example, a study on nitrate levels in a local river can connect to agricultural runoff policy or the UN Sustainable Development Goals.
Pro Tip: Use the funnel structure for your discussion: start with your specific findings, then widen to ESS systems, then widen further to societal or policy implications. This structure mirrors how IB examiners are trained to read scientific discussions.
Common mistakes in ESS practical report writing and how to avoid them
Even well-researched reports lose marks for avoidable errors. Here are the most frequent problems and how to fix them:
- Writing in first person. Reports must be written in third person, past tense, and passive voice. “I measured the pH” becomes “The pH was measured.” This is not just a style preference. It is an IB requirement that signals scientific objectivity.
- Vague methodology. Statements like “a small amount of solution was added” fail the reproducibility test. Every quantity, instrument, and step must be precise enough for replication.
- Exceeding the word limit. The 3,000-word cap does not include tables, figures, and references, but it does include your analysis and evaluation prose. Use a section-by-section word count checklist to stay on track.
- Neglecting uncertainties. Presenting data without uncertainty values tells the examiner you do not understand measurement reliability. Every instrument has a stated precision. Record it and use it.
- Weak or generic evaluation. Listing limitations without explaining their impact or suggesting specific improvements is the single most common reason students score below the top band in evaluation. Be specific, be critical, and be constructive.
Checking your draft against the IB ESS assessment criteria before submission is one of the most effective ways to catch these issues before your examiner does.
Key takeaways
A high-scoring ESS practical report combines a precise research question, reproducible methodology, well-organized data, and a critical evaluation that connects findings to ESS concepts and real-world implications.
| Point | Details |
|---|---|
| Structure follows IB criteria | Every section from RQ to conclusion must align with specific IB rubric expectations. |
| Reproducibility is non-negotiable | Include exact quantities, calibration steps, and repeated trials in your methodology. |
| Separate results from analysis | State patterns first, then interpret them using ESS theory and systems thinking. |
| Evaluation needs specifics | Name each limitation, explain its impact, and suggest a realistic improvement. |
| Word count requires planning | Use a section checklist to stay within the 3,000-word limit without cutting key content. |
What I have learned from tutoring students through ESS practical reports
After working with IB ESS students for over 13 years, I can tell you that the reports that score highest share one quality: they read like genuine scientific communication, not like a school assignment written under pressure. The students who get there are the ones who treat the research question as a real question they actually want to answer.
One pattern I see constantly is students writing their introduction first and then forcing their analysis to match it. Write your introduction last. Once you know what your data actually shows, you can frame your background and context to set it up properly. This small shift produces noticeably stronger reports.
I also notice that students underestimate how much the evaluation section matters. IB examiners are not looking for a perfect experiment. They are looking for a student who understands why their experiment was imperfect and what that means for the reliability of their conclusions. Planning your repeated trials and calibration from day one gives you real material to work with in that section.
Finally, the best ESS reports always connect findings to something bigger. Whether it is local water quality, urban heat islands, or species loss in a fragmented habitat, your conclusion should remind the reader why this investigation matters beyond the classroom. That connection to ESS systems and sustainability is what makes this subject different from standard science courses, and your report should reflect that.
— Marija
Get personalized support for your ESS internal assessment
Writing a strong ESS IA report takes more than reading a guide. It takes feedback on your specific research question, your data, and your draft. At Esstutor, I work one-on-one with IB ESS students to help them select IA topics with real potential, plan their methodology to meet IB criteria, and refine their analysis and evaluation sections for top marks.
Whether you are just starting your practical work or you have a draft that needs a critical eye, personalized coaching makes a measurable difference. Students I work with consistently improve their understanding of what examiners are looking for and how to deliver it. If you want targeted support on your ESS IA, book a session and we can start working on your report together.
FAQ
What is the word limit for an ESS IA practical report?
The IB ESS IA written report has a maximum word count of 3,000 words. Tables, figures, references, and appendices are typically excluded from this count, but check your school’s specific policy.
How do I write the methodology section of an ESS report?
Write your methodology in third person, past tense, and passive voice, including exact quantities, equipment specifications, calibration steps, and the number of repeated trials. The goal is full reproducibility so another researcher could replicate your investigation exactly.
What should an ESS practical report conclusion include?
Your conclusion should directly answer your research question, state whether your hypothesis was supported by the data, and connect your findings to a relevant ESS concept or real-world environmental issue such as eutrophication, biodiversity loss, or climate feedback systems.
How many repeated trials do I need in an ESS investigation?
Three repeated trials per data point is the standard minimum for ESS investigations. More trials improve reliability and give you stronger material for your evaluation section, particularly when discussing uncertainty and variability in your results.
How do I improve my ESS IA evaluation section?
Name each specific limitation, explain how it likely affected your results, and suggest a realistic improvement for each one. Vague references to “human error” score poorly. Specific, methodological critiques tied to your actual data demonstrate the critical thinking IB examiners reward. You can also review sample ESS IA reports to see how strong evaluations are structured.
No Comments