


22 Sep 13 Years’ Examiner Tips for IB ESS Chi Squared From Quadrat Counts
The chi-squared (χ²) test of independence tells you whether two categorical variables from your quadrat data (like species A present/absent versus species B present/absent) show a real association or just random overlap. You need actual counts, not percentages, arranged in a contingency table. When your calculated χ² exceeds the critical value, the co-occurrence pattern is unlikely to be chance. That’s evidence of association, not proof that one species causes the other’s presence.
TL;DR:
- The χ² test requires actual counts from quadrats, with expected counts ideally above five in each cell to ensure reliable results.
- Combining categories or increasing sample size can address low expected counts, preventing unreliable outcomes or zero cells.
- The test only indicates association, not causation, between species distributions, and depends on independent, randomly sampled quadrats.
- Reporting must include all steps: observed and expected tables, χ² value, degrees of freedom, and the significance comparison; interpretations should avoid causal language.
- Using χ² for continuous data, like biomass or pH, is inappropriate; instead, rank-based or regression tests are necessary for those variables.
Table of Contents
- What the IB ESS Chi Quadrat Test Actually Checks
- How to Turn Quadrat Counts Into a Contingency Table
- Worked Example: Testing Association Between Two Plant Species
- Where Students Lose Marks: Assumptions and Examiner Expectations
- Writing Up Your Chi-Squared Results in an IA
- Why This Guidance Comes From Someone Who’s Graded This Exact Test
- Quick Perspective: Design Matters More Than the Test Itself
- Get Direct Help With Your Chi-Squared Calculations and IA Write-Up
- Where to Verify Critical Values and Worked Examples
- Sources
- FAQ
What the IB ESS Chi Quadrat Test Actually Checks
You’re testing independence, not correlation. The null hypothesis (H0) says the two variables are independent, meaning where one species grows has nothing to do with where the other grows. The alternative hypothesis (H1) says there’s an association between them. A typical exam-ready phrasing looks like this: “H0: There is no association between the distribution of Species A and Species B. H1: There is an association between the distribution of Species A and Species B.”
This test only works under specific conditions:
- You need raw counts or frequencies, never derived percentages or density values.
- Your samples must be independent of each other (one quadrat’s result shouldn’t influence another’s).
- Expected counts should be 5 or higher in each cell where possible, a widely used rule of thumb for keeping the test statistically reliable.
If your data is continuous, like biomass or pH readings, χ² is the wrong tool entirely. Use Spearman’s rank correlation for ranked relationships or linear regression for continuous variables that might trend together. Mixing up test types is one of the fastest ways to lose marks on an ESS internal assessment (IA), because percentages and derived densities simply don’t satisfy the assumptions χ² depends on.
How to Turn Quadrat Counts Into a Contingency Table
Before you touch a calculator, decide how you’re recording your species data. Presence/absence gives you a clean 2×2 table (species A present or absent, crossed with species B present or absent). Counting individuals per quadrat and then binning them into categories (low, medium, high abundance) gives you a larger table, but demands more quadrats to keep expected counts above that threshold of 5.
Follow this sequence when converting field data into a workable table:
- Lay out your quadrats randomly or systematically across the study area, recording species A and species B status in each one.
- Tally the four (or more) combinations into an observed frequency table: A present/B present, A present/B absent, A absent/B present, A absent/B absent.
- Calculate row and column totals, then the grand total across all quadrats.
- Compute expected frequency for each cell using (row total × column total) / grand total.
- Keep every raw count visible in your working, since examiners want to trace your logic from field notebook to final statistic.
Pro Tip: Photograph your quadrat tally sheet before you leave the field site. A blurry memory of “I think it was six quadrats with both species” will not hold up when you’re rebuilding your observed table three weeks later at your desk.
Worked Example: Testing Association Between Two Plant Species
Say you sampled 60 quadrats along a shoreline transect, recording presence or absence of Species A (a salt-tolerant grass) and Species B (a low-growing succulent). Your observed table looks like this:
| Species B present | Species B absent | Row total | |
|---|---|---|---|
| Species A present | 18 | 7 | 25 |
| Species A absent | 6 | 29 | 35 |
| Column total | 24 | 36 | 60 |
Expected frequencies come from (row total × column total) / grand total:
- A present, B present: (25 × 24) / 60 = 10
- A present, B absent: (25 × 36) / 60 = 15
- A absent, B present: (35 × 24) / 60 = 14
- A absent, B absent: (35 × 36) / 60 = 21
Now apply Σ (O−E)² / E to each cell and sum the results:
- (18−10)²/10 = 6.4
- (7−15)²/15 = 4.27
- (6−14)²/14 = 4.57
- (29−21)²/21 = 3.05
The calculated χ² value exceeds the critical value for df = 1, indicating statistical significance
Degrees of freedom for a 2×2 table is (rows−1)(columns−1) = 1. At df = 1, the critical value at the 0.05 significance level is 3.84. Since 18.29 exceeds that threshold, you reject H0. Your worked interpretation should read something like: “There is a statistically significant association between the distribution of Species A and Species B (χ² = 18.29, df = 1, p < 0.05), suggesting these species may share habitat preferences or interact positively rather than occurring independently.”
Where Students Lose Marks: Assumptions and Examiner Expectations
Most χ² errors happen before the arithmetic even starts. Getting the conclusion wording wrong is common. Say “associated with” rather than “causes” or “affects,” since χ² can never establish causation on its own.
Watch for these recurring problems:
- Expected counts below 5 in more than one cell, which weakens the test’s reliability and usually means you need more quadrats or fewer categories.
- Zero cells in your observed table, which can inflate χ² artificially and often signals you should combine adjacent categories.
- Arithmetic slips in the (O−E)² step, particularly forgetting to square before dividing by E.
- Reporting a χ² value without stating degrees of freedom or the critical value used for comparison.
Pro Tip: If two of your cells keep landing below 5 expected, don’t panic and abandon the test. Combine sparse categories (merge “low” and “medium” abundance into one group, for instance) so your remaining cells hit the threshold without losing the ecological question you’re asking.
Examiners want to see every step of your working, not just the final statistic. ThinkIB’s guidance on statistical tests stresses that choosing the right test and reporting significance clearly matters as much as the calculation itself.
Writing Up Your Chi-Squared Results in an IA
Your IA needs a specific sequence of elements, laid out so both your teacher and the external examiner can follow your logic without guessing.
- Present the observed contingency table with clear row and column labels and totals.
- Show at least one full expected frequency calculation, not just the final numbers.
- State your χ² value, degrees of freedom, and the critical value or p-value you compared it against.
- Give your decision (reject or fail to reject H0) in plain language.
- Interpret the ecological meaning, connecting the statistic back to your research question.
- Note limitations, such as small sample size, uneven quadrat placement, or seasonal timing that might have skewed results.
A useful template for your results section: “The calculated χ² value of [X] exceeds the critical value of [Y] at df = [Z], indicating a significant association between [variable 1] and [variable 2].” For limitations, something like “A larger number of quadrats would strengthen confidence in this result, particularly given that two cells had expected counts close to the minimum threshold” works well. Label every table with units where relevant, and consider appending your raw tally sheet as an appendix. Full IA structure guidance can help you see how this fits into the broader assessment criteria.
Why This Guidance Comes From Someone Who’s Graded This Exact Test
This guidance comes from Marija, an IB examiner with more than 13 years of experience teaching and assessing ESS and Geography students. She’s reviewed hundreds of IAs that lean on χ² for species association questions, which means she’s seen exactly where students lose marks and exactly what earns them.
A typical IA feedback session walks through your raw quadrat counts, builds the contingency table with you, checks your expected frequency arithmetic, and tightens your interpretation wording so it matches what examiners expect to read.

Quick Perspective: Design Matters More Than the Test Itself
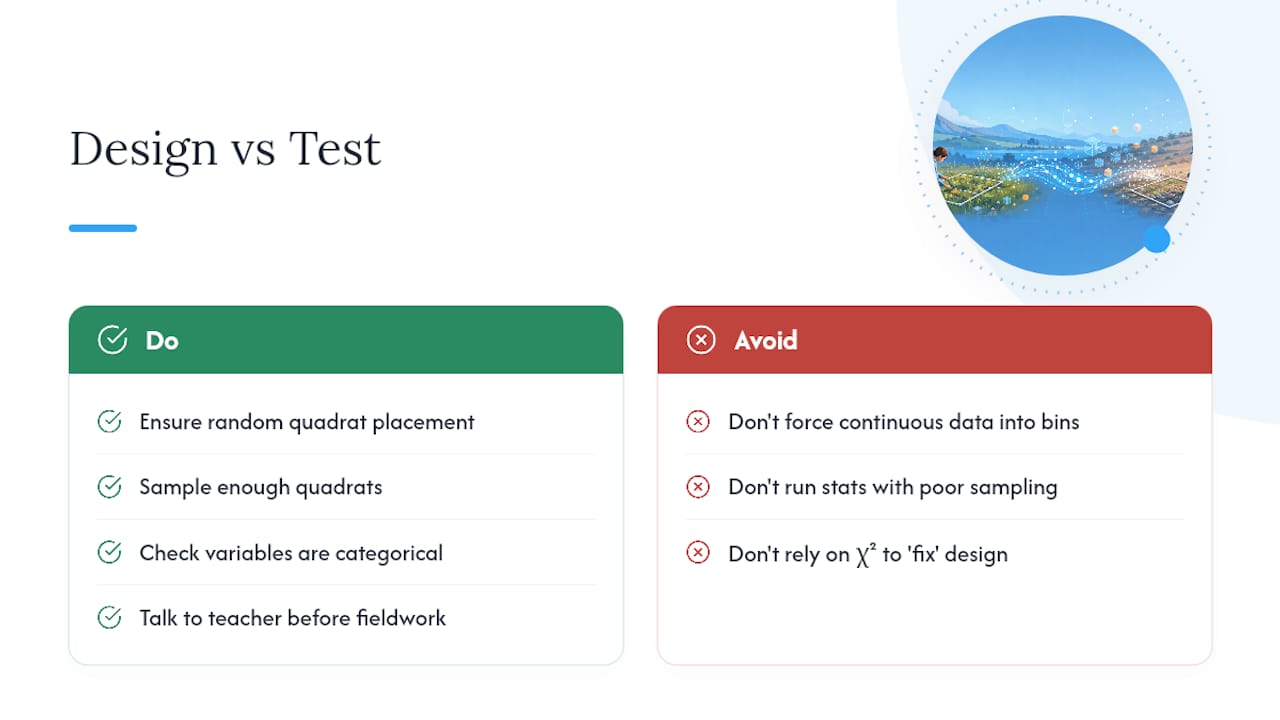
Here’s what gets overlooked: a perfectly executed χ² calculation cannot rescue a poorly designed sampling strategy. If your quadrats weren’t placed randomly, or you didn’t sample enough of them, the test will still spit out a number. That number just won’t mean much.
Before you run any statistics, ask whether your variables are genuinely categorical. If you’re really measuring a continuous gradient, Spearman’s or regression will serve your data better than forcing it into presence/absence bins. Talk to your teacher or tutor before you finish fieldwork, not after. A ten-minute conversation about sample size can save you from rebuilding an entire dataset in April.
— Marija
Get Direct Help With Your Chi-Squared Calculations and IA Write-Up
Personalized tutoring services can help students who need someone to check their actual quadrat numbers, not just read another explanation of the formula. An experienced tutor can work through your specific contingency table, catch expected-count problems before they become IA red flags, and refine your interpretation wording so it reads like an examiner wrote it.

A typical session built around χ² starts with your raw quadrat data and research question, moves through building the observed and expected tables together, and finishes with wording for your results and limitations sections. The Trial Plan runs 34 € for 20 minutes if you want to test the fit before committing further, while the Basic Plan covers a full 60-minute session at 120 €. For IA-specific support, the dedicated IA tutoring page outlines what feedback on your data analysis and evaluation section looks like. Bring your raw counts and a draft calculation, and book a session through the pricing page to get started.
Where to Verify Critical Values and Worked Examples
- BioNinja’s chi-squared breakdown covers hypothesis setup and critical value tables.
- Save My Exams’ revision notes offer additional worked examples for cross-checking your method.
Sources
- Thinkib
- Chi-Squared Test: Skills (DP IB Biology: SL): Revision Note — Save My Exams
- Chi Squared Test — BioNinja
FAQ
What Does a Significant χ² Result Mean for Quadrat Data?
A significant result means the observed pattern of species co-occurrence in your quadrats is unlikely to have happened by chance alone. It points to an association between the two species’ distributions, but it does not prove one species causes the other’s presence.
Can I Use Percentages Instead of Raw Counts for Chi-Squared?
No. The χ² test requires actual counts or frequencies from your quadrats, not percentages or density values. Converting to percentages before running the test invalidates the calculation.
How Do I Choose Between Chi-Squared and Spearman’s Rank?
Use chi-squared when both variables are categorical, like presence/absence data from quadrats. Use Spearman’s rank correlation when you’re working with ranked or continuous data, such as abundance scores along an environmental gradient.
What If My Expected Counts Are Below 5?
Combine adjacent categories to raise your expected counts above the threshold, or increase your quadrat sample size. Leaving low expected counts unaddressed weakens the reliability of your χ² result and is a common point examiners flag in IA feedback.
Does Esstutor Help With Chi-Squared Calculations for IAs?
Yes. Esstutor’s tutoring sessions walk through your specific quadrat data, build the contingency table with you, and refine your results and interpretation wording. Pricing starts with a Trial Plan at 34 € for 20 minutes.
No Comments