

02 Jul Step by Step Guide to ESS IA: Score Higher
TL;DR:
- The IB Environmental Systems and Societies Internal Assessment is a crucial project worth 25% of the SL grade and 20% of the HL grade. It requires a focused research question, systematic data collection, and honest evaluation within a 3,000-word limit to succeed.
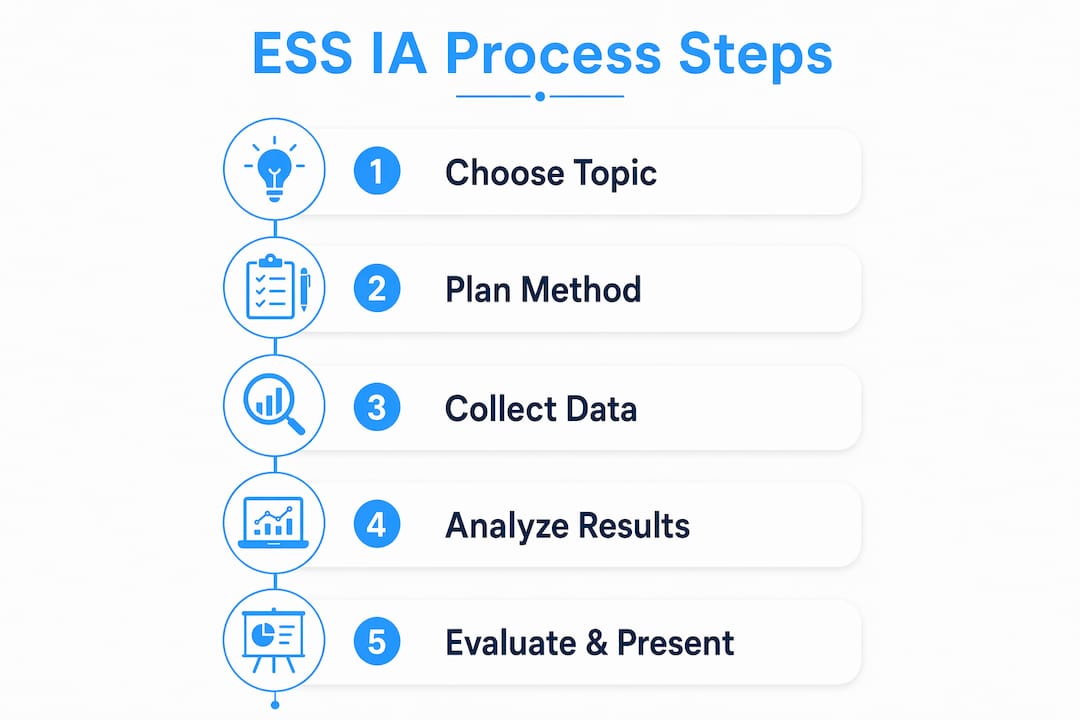
The IB Environmental Systems and Societies Internal Assessment is a mandatory individual investigation that counts 25% of your SL grade and 20% of your HL grade. That weighting makes it one of the most important pieces of work you will submit. The IA has a word limit of 3,000 words, so every sentence needs to earn its place. This step by step guide to ESS IA walks you through each phase of the process, from picking your research question to submitting a polished report, so you know exactly what to do and when.
What does a step by step guide to ESS IA look like?
The ESS IA is formally called an individual scientific investigation. It requires you to identify an environmental issue, collect primary or secondary data, analyze your findings, and evaluate your methods critically. The IB assesses it both internally by your teacher and externally by a moderator. That dual assessment means your work needs to be clear enough for someone who has never visited your study site to follow and evaluate it.
Before you write a single word, answer six framing questions: What is the environmental issue? Where is the study location? What strategy or management approach is relevant? What tensions or trade-offs exist? What type of data will you collect? What do you expect to find? These six questions, drawn from IB ESS IA preparation guidance, act as a blueprint for the entire investigation. Students who skip this step often find their reports lack focus and lose marks in the analysis and evaluation criteria.
How do you choose a strong research question for your ESS IA?
A strong research question is focused, measurable, and tied to a specific environmental issue and location. Broad topics like “climate change” or “pollution” are not research questions. They are categories. Your question needs to be narrow enough to answer with the data you can realistically collect in a school term.
Two reliable starting points work well. You can begin with an environmental issue you care about, such as soil degradation or species diversity loss, and then find a local site where that issue is visible. Alternatively, you can start with a location you can access easily, such as your school grounds, a nearby park, or a local stream, and then identify what environmental variable is worth measuring there. Examiners favor local, accessible study sites because they allow for thorough, repeatable data collection. A student measuring water quality in a stream two blocks from school will almost always produce better data than one trying to analyze a remote wetland from secondary sources alone.
A strong research question meets all of these criteria:
- Focused: It asks about one specific variable or relationship.
- Measurable: You can collect real data to answer it.
- Location-specific: It names or implies a defined study site.
- Linked to an environmental strategy: It connects to a management approach or policy.
- Feasible: You can complete it with available equipment and time.
Examples of strong research questions include: “How does distance from a busy road affect particulate matter levels in soil samples collected at Riverside Park?” or “What is the relationship between canopy cover and understory plant species diversity in the school woodland?”
Pro Tip: Write three candidate research questions before committing to one. Show them to your teacher and ask which one has the clearest data collection pathway. The answer will save you weeks of frustration.
You can also find topic ideas that impress examiners on the Esstutor website, where real examples are broken down by environmental theme.
What planning and preparation are essential before collecting data?
Planning is where most students either set themselves up for success or quietly sabotage their own IA. Effective planning means identifying your variables, choosing your data collection method, and writing a detailed procedure before you go anywhere near a field site or lab.
Start by identifying your independent variable (what you change or compare), your dependent variable (what you measure), and your controlled variables (what you keep constant). For example, if you are comparing species diversity across two habitat types, the habitat type is your independent variable, the species diversity index is your dependent variable, and the time of day and season of sampling are controlled variables.
Your data collection method will fall into one of four categories: fieldwork, laboratory work, surveys, or secondary data analysis. Each has different reliability considerations. Fieldwork gives you primary data but requires careful standardization. Surveys introduce human bias and need a large enough sample size to be meaningful. Secondary data is useful for long-term trends but must come from credible, citable sources.
| Data collection type | Best used for | Key reliability concern |
|---|---|---|
| Fieldwork | Measuring physical or biological variables on site | Standardizing technique across all samples |
| Laboratory work | Controlled chemical or biological analysis | Equipment calibration and contamination |
| Survey | Measuring human attitudes or behaviors | Sample size and question bias |
| Secondary data | Long-term trends, large-scale comparisons | Source credibility and data currency |
Pro Tip: Write your procedure in enough detail that a classmate who has never seen your project could follow it exactly. If they cannot replicate your method, your data reliability section will be weak.
How to collect and organize data effectively for your ESS IA
Systematic, accurate data collection is the foundation of a credible IA. The most common mistake students make is collecting data informally and then trying to organize it afterward. That approach leads to gaps, inconsistencies, and lost marks.
Follow these practices every time you collect data:
- Design your recording table before you go. Create a spreadsheet or printed table with all variable columns labeled, units included, and space for at least five repeated measurements per sample point.
- Record raw data immediately. Never rely on memory. Write down every measurement at the moment you take it, including any anomalies or observations about conditions.
- Note environmental conditions. Record temperature, weather, time of day, and any unusual circumstances. These details matter when you evaluate your data later.
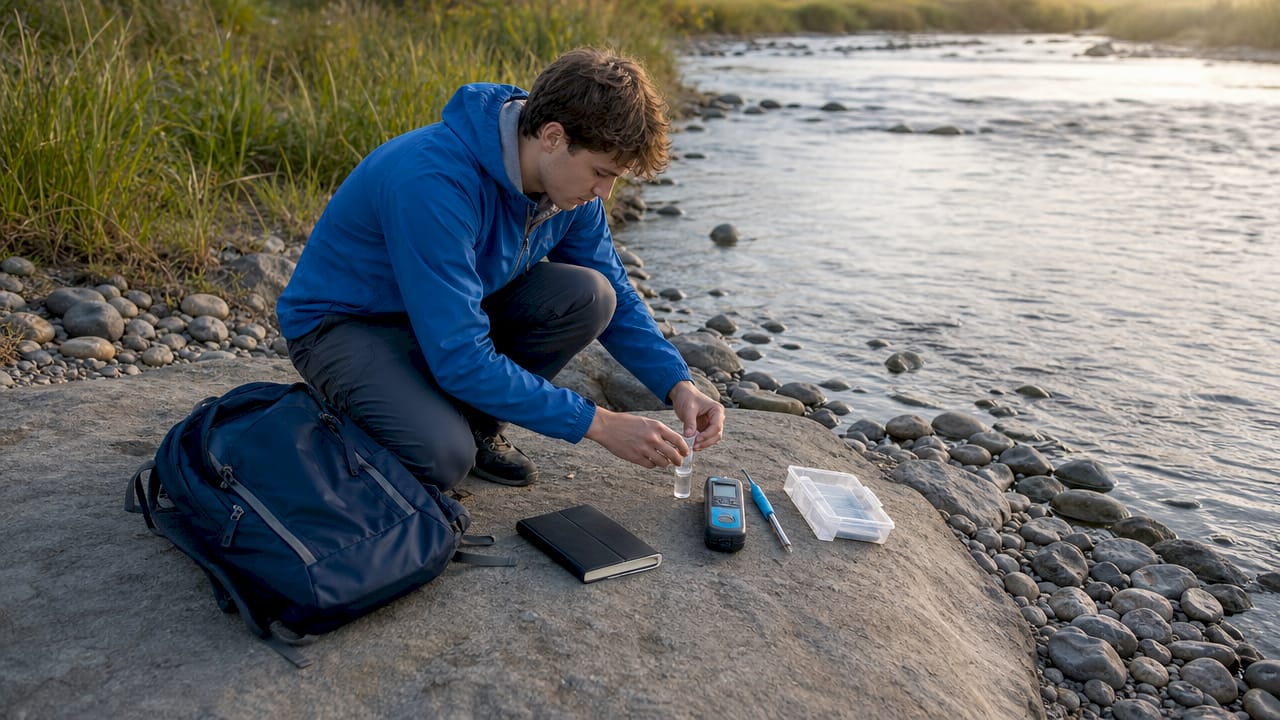
- Photograph your study site. Images of your quadrats, transects, or sampling locations provide evidence of your methodology and strengthen your report.
- Use consistent units throughout. Switching between milligrams and grams, or Celsius and Fahrenheit, introduces errors that are hard to catch later.
Commonly measured environmental variables in ESS IAs include pH levels, dissolved oxygen, turbidity, species richness, percentage cover, light intensity, soil compaction, and noise levels in decibels. Secondary data, such as government air quality records or published biodiversity surveys, can supplement your primary data. Always cite secondary sources with full references and note the date the data was collected, since environmental data changes over time.
How do you analyze your data and draw conclusions in the ESS IA?
Data analysis is where your investigation becomes an argument. Analysis must connect your findings directly back to your research question using appropriate graphical and statistical tools. Raw data tables alone do not constitute analysis.
Choose your analytical tools based on your data type:
- Scatter graphs with trend lines: Use these to show correlations between two continuous variables, such as distance from a road and soil lead concentration.
- Bar charts or histograms: Use these to compare categories, such as species richness across three habitat zones.
- Simpson’s Diversity Index or Shannon Index: Use these to quantify biodiversity in a way that examiners recognize and reward.
- Spearman’s rank correlation: Use this to test the strength of a relationship between two ranked variables when your data set is small.
- Percentage change calculations: Use these to compare before and after values or to standardize data from different sample sizes.
When you interpret your results, state clearly whether your data shows a positive correlation, a negative correlation, or no clear relationship. Then explain what that pattern means in the context of your environmental issue. A negative correlation between canopy cover and light intensity is expected. What matters is whether your data confirms or challenges that expectation, and why.
Avoid two common errors. First, do not draw conclusions that go beyond your data. If your sample size is small, acknowledge that limitation rather than overstating your findings. Second, do not ignore anomalous data points. Address them directly and suggest a plausible explanation.
Pro Tip: Label every graph with a descriptive title, axis labels with units, and a figure number. Examiners deduct marks for unlabeled visuals, and it takes less than a minute to add these details.
For more guidance on writing an outstanding ESS IA, Esstutor has a detailed breakdown of how top-scoring students structure their analysis sections.
What should be included in the evaluation and presentation of your ESS IA?
Evaluation is the section where students most often lose marks they could easily keep. IB assessment criteria require you to reflect on your methods’ strengths and weaknesses and suggest specific improvements. Vague statements like “my method could have been better” earn no credit. Specific, evidence-based critique does.
Structure your evaluation using this sequence:
- Assess your methodology. Identify at least two genuine strengths of your data collection approach and explain why they improve reliability or validity.
- Identify limitations. Name specific weaknesses, such as a small sample size, seasonal timing constraints, or equipment precision limits. Quantify them where possible.
- Suggest improvements. For each limitation, propose a concrete fix. “Increasing sample size from 10 to 30 quadrats would reduce the effect of local variation” is a strong improvement suggestion.
- Propose further research. Suggest one or two related questions your investigation raises but does not answer. This shows scientific thinking and earns marks in the higher criteria bands.
- Check your report structure. Your final report should include a title, research question, background information, methodology, data, analysis, evaluation, and a full reference list.
Formatting matters more than most students expect. Keep your word count under 3,000 words, use consistent citation formatting (MLA or APA are both acceptable), and number all figures and tables. Avoiding common mistakes such as unsupported conclusions, missing references, and unclear methodology descriptions directly improves your score.
Pro Tip: Read your report aloud before submitting it. If a sentence sounds confusing when spoken, it will confuse an examiner too. Rewrite it until it is clear.
Key takeaways
A successful ESS IA requires a focused research question, systematic data collection, evidence-based analysis, and honest evaluation of your methods, all within a 3,000-word limit.
| Point | Details |
|---|---|
| IA grade weighting | The IA counts 25% of SL and 20% of HL, making it a major grade component. |
| Choose a local study site | Examiners reward accessible, repeatable sites over ambitious but impractical locations. |
| Plan before you collect | Identify variables and write your full procedure before any fieldwork begins. |
| Connect analysis to your question | Every graph and statistic must link back to your research question directly. |
| Evaluate with specifics | Name exact limitations and propose concrete improvements to score in higher bands. |
What I have learned from guiding students through the ESS IA
After working with IB ESS students for over 13 years, the pattern I see most often is this: students who struggle with the IA do not struggle because the science is too hard. They struggle because they started without a clear plan.
The students who score highest are almost always the ones who chose a small, manageable investigation close to home. A student who spent three weeks measuring soil compaction along a footpath in her local park produced one of the strongest IAs I have seen. Her question was narrow, her data was clean, and her evaluation was honest. She did not try to solve global deforestation. She answered one specific question well.
The second thing I have noticed is that feedback is only useful if you act on it quickly. Students who receive a draft comment and wait two weeks to revise it almost always repeat the same errors. Build revision time into your schedule from the start. Treat your first draft as a working document, not a finished product.
One more thing I want to say directly: do not underestimate the evaluation section. Most students write it last and give it the least attention. Examiners read it carefully. A thoughtful, specific evaluation can lift your score by several marks even when your data is imperfect. Imperfect data with excellent evaluation beats perfect data with a weak evaluation almost every time.
— Marija
How Esstutor can help you complete your ESS IA
Getting personalized support during your ESS IA makes a real difference, especially when you are stuck on your research question or unsure how to structure your analysis. Esstutor offers one-on-one online tutoring from an IB examiner with over 13 years of experience working with ESS students worldwide.
Whether you need help choosing a topic, reviewing your methodology, or polishing your evaluation section, Esstutor provides targeted feedback at every stage of the process. You can also access the ESS internal assessment guide for a full overview of IB criteria and scoring expectations. Students preparing for both their IA and final exams can find additional resources through the ESS Extended Essay guide to build on their investigation skills. Book a trial lesson and get clear, specific guidance on exactly where your IA needs work.
FAQ
How much is the ESS IA worth?
The ESS IA counts 25% of the SL grade and 20% of the HL grade. It is one of the largest single components of your final IB score.
What is the word limit for the ESS IA?
The ESS IA has a recommended word limit of 3,000 words. Exceeding it risks penalization, so every section needs to be concise and purposeful.
What makes a good ESS IA research question?
A strong research question is focused, measurable, location-specific, and linked to an environmental strategy. Examiners prefer questions tied to local, accessible study sites where data collection is repeatable.
Can I use secondary data in my ESS IA?
Yes, secondary data is acceptable and can strengthen your investigation, particularly for long-term trends. Always cite your sources fully and note when the data was originally collected.
What are the most common reasons students lose marks on the ESS IA?
The three most common causes of lost marks are a lack of focus in the research question, poor data recording practices, and unsupported conclusions in the analysis. A specific, honest evaluation section can recover marks even when data collection had limitations.
No Comments