

08 Oct IB Carrying Capacity: 5 Step Diagram Checklist to Earn Marks
Carrying capacity, or K, is the maximum population size that an environment can support indefinitely without damaging the resources that population depends on. It appears throughout IB Biology, Geography, and ESS in logistic growth models, limiting-factor questions, and human-systems debates. We’ll walk through the definition, the formula, and the exact phrasing that earns marks in exam answers.
TL;DR:
- A population’s carrying capacity is dynamic and can shift due to environmental changes, not a fixed number, influencing how limits are assessed.
- Logistic growth models show populations oscillate around K, often overshooting and crashing, rather than settling precisely at the carrying capacity.
- Specific limiting resources like food or water define K, with droughts or resource surpluses causing temporary overshoot or declines.
- Different forms like physical or perceptual carrying capacity are applied in geography and ESS, with human adaptation further complicating measurement.
- Accurate exam answers require clear diagram labeling of K, detailed resource identification, and linking data trends explicitly to the concept of carrying capacity.
Table of Contents
- 1. What carrying capacity means in IB biology, geography and ESS
- 2. S-shaped and J-shaped growth and the logistic formula
- 3. Limiting factors that set carrying capacity
- 4. Types and applications of carrying capacity in Geography and ESS
- 5. How to answer IB exam questions on carrying capacity
- 6. Applying carrying capacity in IA/EE investigations
- What examiners actually look for in carrying capacity answers
- Get examiner-level feedback on your carrying capacity answers
- FAQ
- Sources
1. What carrying capacity means in IB biology, geography and ESS
When a population sits at K, births (plus immigration) roughly balance deaths (plus emigration), so numbers hover around a stable point rather than growing forever. K isn’t a fixed number stamped onto a habitat. It shifts with rainfall, season, disease outbreaks, or a new predator moving in, which is exactly why IB mark schemes reward answers that treat carrying capacity as dynamic rather than permanent.
A simple way to picture it: a yeast colony in a flask of sugar solution grows fast at first, then slows as sugar runs low and waste products build up, until the population flattens out near K. The flask’s size and sugar supply set that ceiling.
When you write exam answers, always tie K to a specific resource or constraint rather than leaving it abstract:
- Name the limiting resource (food, water, nesting space, light) that actually caps the population.
- State whether K applies to a single species or a wider ecosystem context.
- Mention that K can rise or fall with environmental change, not just stay static.
2. S-shaped and J-shaped growth and the logistic formula
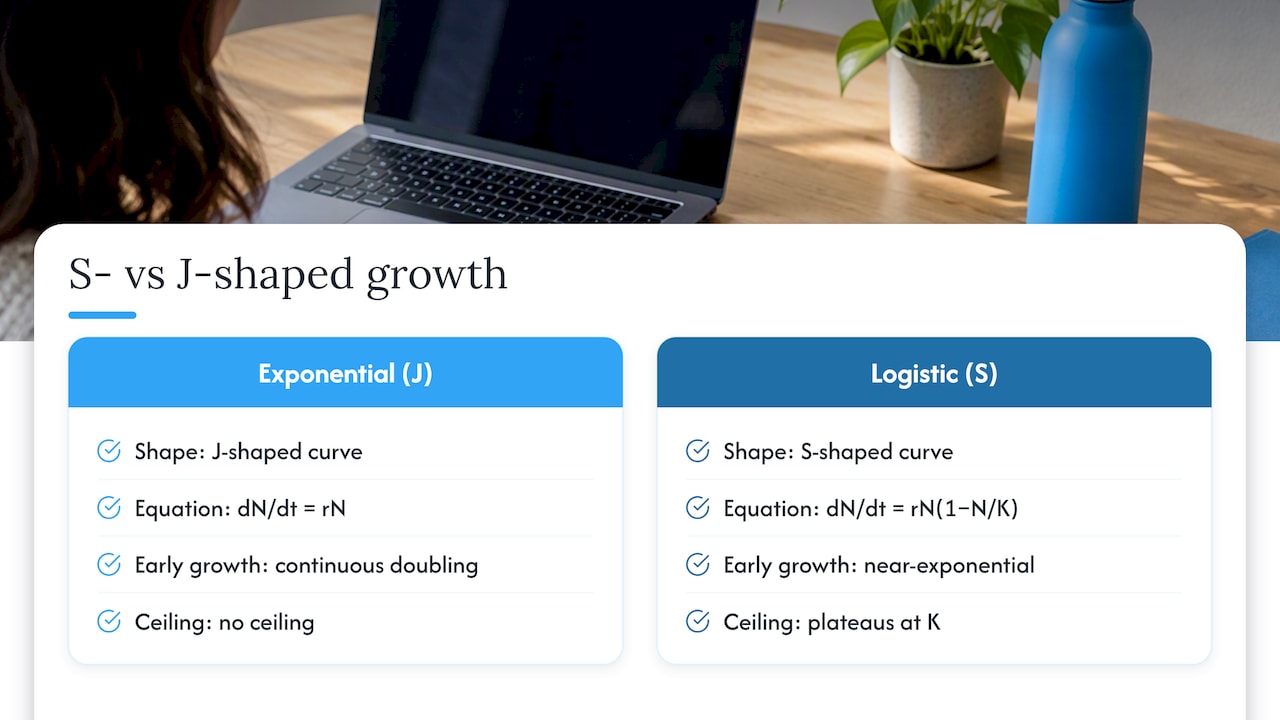
Exponential growth produces a J-shaped curve: population size keeps doubling with no ceiling, which only happens briefly in nature, often right after a species colonizes a new habitat. Logistic growth produces an S-shaped curve instead. Growth starts exponentially, then slows as resources become scarce, and finally plateaus at carrying capacity.
The IB syllabus expresses this with the logistic equation: dN/dt = rN(1 − N/K), where N is population size, r is the intrinsic growth rate, and K is carrying capacity. The term (1 − N/K) is doing the real work here: when N is small compared to K, that fraction is close to 1 and growth looks almost exponential; as N approaches K, the fraction shrinks toward zero and growth slows to a stop, according to Biology LibreTexts/8%3A_Ecology/45%3A_Population_and_Community_Ecology/45.3%3A_Environmental_Limits_to_Population_Growth).
Real populations rarely sit neatly on K. Field data from classic studies on seal and sheep populations show numbers overshooting K and then dropping back, oscillating around the line rather than settling on it, as outlined in CUNY’s ecology courseware. That oscillation is worth mentioning whenever an exam question asks you to evaluate the logistic model against real-world data.
3. Limiting factors that set carrying capacity
Carrying capacity is only ever as high as the scarcest resource allows, and the IB syllabus expects you to name specific factors rather than gesture at “the environment.”
- Biotic factors: food availability, predation pressure, disease and parasites, and competition from other species.
- Abiotic factors: water supply, temperature range, light availability, and physical space.
- Density-dependent factors: competition and disease intensify as population density rises, pulling numbers back toward K through negative feedback.
- Overshoot triggers: a temporary resource surplus, like a mild winter boosting food supply, can let a population exceed K briefly before a crash follows.
A strong exam example: a rabbit population limited by grass availability will show K drop sharply during drought, then recover once rainfall returns, because the limiting resource itself changed.
Pro Tip: When an exam question gives you a graph with a population overshooting then crashing, name the specific resource that was depleted. That single detail often separates a 2-mark answer from a full-mark one.
4. Types and applications of carrying capacity in Geography and ESS
IB Geography and ESS extend carrying capacity beyond pure ecology, and exam questions often test whether you know which version applies.
- Ecological carrying capacity: the maximum population a species’ habitat can sustain long-term, the classic biology definition.
- Physical carrying capacity: the maximum number of users a space can physically hold, used for tourist sites, car parks, or trail capacity.
- Perceptual (social) carrying capacity: the point at which visitors feel the site is too crowded to enjoy, even if physical space remains.
A beach resort might have physical room for thousands of visitors, but its perceptual carrying capacity, the point where crowding ruins the experience, is reached far sooner. Fisheries and rangeland management use similar overlapping concepts: a fishery’s ecological K is set by fish stock renewal, while its economic carrying capacity depends on catch profitability. When human systems are involved, exam answers should flag that carrying capacity becomes harder to measure precisely, since human adaptation, technology, and trade can shift the apparent limit.
5. How to answer IB exam questions on carrying capacity
Examiners reward precision over length. A clean, labeled diagram and the right command-term response often earn more marks than a long paragraph.
- Draw the axes first: population size (N) on the y-axis, time on the x-axis.
- Sketch the curve shape: a lag phase, a steep exponential-like rise, then a bend flattening into a plateau.
- Label K explicitly: draw a dashed horizontal line at the plateau and write “K = carrying capacity” directly on it.
- Mark the inflection point: where growth rate is fastest, roughly halfway to K.
- Add a brief caption: one line noting what limiting factor caused the plateau.
Command terms shape how much detail you need. “Describe” wants observable trends (“the population grows rapidly, then slows as it nears K”). “Explain” wants mechanisms (“growth slows because food becomes scarce, increasing competition and reducing birth rate”). “Discuss” or “evaluate” wants you to weigh the model against real data, such as oscillation around K or overshoot.
Pro Tip: Keep a one-line template ready: “As N approaches K, [resource] becomes limiting, reducing the growth rate until births and deaths balance.” Reuse that structure across different exam questions.
6. Applying carrying capacity in IA/EE investigations
Carrying capacity makes a strong IA or EE topic, but it demands careful methods since K itself can’t be measured directly, only estimated from population trends over time.
- Microcosm experiments: growing yeast, duckweed, or Daphnia in controlled containers lets you track population density against a known resource supply.
- Field sampling: transects and quadrats measure population density across a habitat gradient, useful for plant or invertebrate studies.
- Long-term data analysis: published population records let you identify plateaus and oscillations without running your own experiment.
- Operationalize K carefully: use density counts, resource proxies (like food biomass), and replicate samples so your conclusion isn’t based on a single reading.
Examiners prioritize clarity over ambition. Define exactly which carrying capacity you’re measuring, acknowledge uncertainty in your density estimates, and connect your data directly back to K rather than assuming a plateau proves it, a point echoed in discussions of carrying capacity’s application nuances. Our guide on IB Geography fieldwork sampling methods covers transect and quadrat technique in more depth if you’re planning this kind of IA.
What examiners actually look for in carrying capacity answers
After years of marking IB ESS and Geography papers, the mistakes I see most often aren’t about knowledge gaps, they’re about precision. Students know what K means but describe it vaguely instead of naming the specific limiting resource. Diagrams often skip labeling K altogether, which costs easy marks. The fix is simple: always name a resource, always label the diagram, and always link your data point back to K explicitly rather than letting the reader infer it.
— Marija
Get examiner-level feedback on your carrying capacity answers
We offer one-on-one online tutoring built around exam precision, with sessions led by an experienced tutor knowledgeable in IB ESS and Geography. A session can walk through your diagram labeling, tighten your phrasing on command-term responses, or review an IA draft that uses carrying capacity as its core concept.

- Trial Plan: a short session to help you test the tutoring approach.
- Basic Plan: a longer session for focused exam technique or IA feedback.
- IA and EE feedback: targeted review for coursework.
For current prices, please see our pricing page.
If your IA touches on population density, r and K strategies, or limiting factors, our guide on scoring IB ESS marks with r and K strategists pairs well with a feedback session. Ready to start? Check our pricing and booking page to pick the session that fits.
FAQ
What is the definition of carrying capacity?
Carrying capacity is the maximum population size an environment can support indefinitely without degrading the resources that population relies on, often denoted by the symbol K, according to Britannica. In IB contexts, it’s tied directly to specific limiting resources like food, water, or space.
What is the carrying capacity formula?
The logistic growth equation, dN/dt = rN(1 − N/K), models how population growth slows as N approaches K, where N is population size, r is the growth rate, and K is carrying capacity, as explained by Biology LibreTexts. The term (1 − N/K) shrinks toward zero as the population nears its limit.
When growth proceeds at a rate similar to 2, 4, 8, 16, 32, 64, what is it called?
That pattern, where numbers double at each step, describes exponential growth, producing a J-shaped curve. It happens when resources aren’t yet limiting, which rarely continues for long in real ecosystems.
What does carrying capacity mean in math?
Mathematically, carrying capacity is the constant K in the logistic growth equation that represents the upper limit a growth curve approaches but doesn’t exceed over the long term. It appears as the plateau value in an S-shaped curve.
How is carrying capacity different from biodiversity?
Carrying capacity measures how many individuals of one population an environment can sustain, while biodiversity measures the variety of species and genetic diversity within an ecosystem. A habitat can have a high carrying capacity for one species while still supporting low overall biodiversity.
No Comments