

06 Oct 10 Fieldwork Ready IB Geography IA Topics Examiners Approve
We put together a set of fieldwork-ready IB Geography IA topic prompts and a step-by-step workflow to turn any idea into a measurable, examiner-aligned research question. You’ll find a quick checklist, topic ideas sorted by theme, method and sampling guidance, annotated RQ examples, and the pitfalls that cost students the most marks.
TL;DR:
- Narrow your research question to a specific location, measurable variables, and a clear link to the syllabus to avoid losing marks for broad themes.
- Use at least two complementary primary methods, justify your sampling strategy, and conduct a pilot study to test instruments and instructions before the main data collection.
- Map out your sampling points and own the operational definitions of variables to ensure the data collected directly answers your research question.
- Use appropriate visualizations and statistical tests like Spearman’s rank or chi-squared to interpret patterns and anomalies in your data.
- Avoid vague questions, insufficient methods, and poor justification, as they are common pitfalls that cost marks and hinder effective analysis.
Table of Contents
- 1. Quick checklist: what makes a high-scoring IB Geography IA topic
- 2. Topic ideas by theme (ready-to-adapt prompts across common syllabus areas)
- 3. How to turn an idea into a measurable research question and testable hypotheses
- 4. Field methods and sampling: what to plan, pilot and justify
- 5. Data presentation and analysis: tests, maps and examiner expectations
- 6. Annotated strong-RQ examples with examiner-style notes
- 7. Common pitfalls and examiner tips from an IB examiner
- 8. Author perspective: examiner note and next steps
- How Esstutor can help with IA topic refinement and examiner feedback
- FAQ
- Sources
1. Quick checklist: what makes a high-scoring IB Geography IA topic
A strong IA topic is never a broad theme. It’s a specific question tied to one place, one set of measurable variables, and one clear link to the syllabus. According to examiner guidance on IA structure, the best topics are highly localized and measurable because vague themes cannot demonstrate fieldwork design or spatial analysis.
Before you commit to an idea, run it through this checklist:
- Location and variables: can you name the exact site and the variable you’ll measure there, such as river velocity at three points along a meander?
- Syllabus link: does the question connect clearly to a topic you’ve studied, like urban environmental quality or coastal management?
- Two methods minimum: can you collect at least two complementary types of primary data, such as pedestrian counts paired with an environmental quality survey?
- Feasible sampling: is your sampling strategy realistic given the time, access and group size you actually have?
- Pilot plan: have you scheduled a trial run to test your instruments and instructions before the real data collection day?
If an idea fails two or more of these checks, narrow it further before you start collecting data. The IB Geography IA mark scheme ties Criterion A directly to a mapped research area and an explicit syllabus connection, so skipping this step costs marks before you’ve even gathered a single data point.
2. Topic ideas by theme (ready-to-adapt prompts across common syllabus areas)
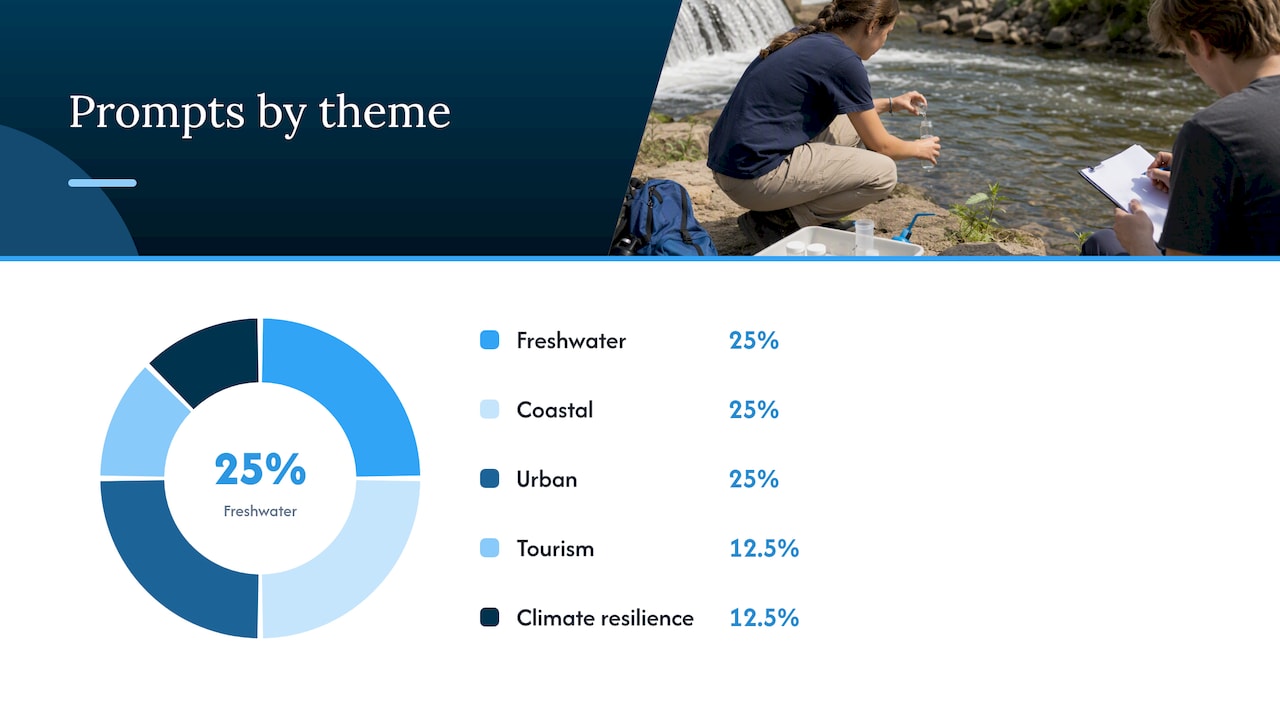
Here are topic prompts organized by the themes most IA students draw from. Each one names the variables you’d measure and a method that fits a typical school timetable. Adapt the location to wherever you have safe, repeated access.
- Freshwater and fluvial processes. Investigate how channel width and velocity change downstream along a local stream, measuring width, depth and velocity at five sites using a flow meter and metric tape.
- Freshwater and fluvial processes. Examine the relationship between bedload particle size and distance from source, using a systematic pebble count at regular intervals along the channel.
- Coastal environments. Study how beach profile gradient varies with distance from a groyne, using a clinometer and ranging poles at paired sites either side of the structure.
- Coastal environments. Assess how wave energy and longshore drift relate to sediment sorting on a local beach, combining a sediment size survey with timed float tests.
- Urban environments. Explore how environmental quality changes with distance from a town center, using a bipolar survey at systematic intervals along a transect.
- Urban environments. Investigate the relationship between pedestrian footfall and retail type along a high street, using timed counts paired with a land use survey.
- Tourism and leisure. Measure how visitor satisfaction and perceived crowding vary across a tourist site at different times of day, using short questionnaires and observational counts.
- Tourism and leisure. Examine how footpath erosion correlates with visitor density on a popular trail, measuring path width and depth at points of varying proximity to key attractions.
- Geomorphology and geophysical hazards. Investigate how slope angle and vegetation cover relate to visible erosion scars on a local hillside, using a clinometer and a simple vegetation cover estimate.
- Population and change. Explore how housing age and quality vary with distance from a town center, using a housing quality index scored at stratified sampling points.
For climate vulnerability and resilience, a feasible classroom-scale option is comparing flood risk perception among residents at varying distances from a floodplain, using short structured interviews alongside a simple exposure map. This keeps the investigation grounded in primary data you can realistically collect within a school term rather than relying on secondary climate datasets that are harder to analyze at a local scale.
Whichever prompt you adapt, write down the independent variable, the dependent variable and your sampling interval before you leave for the field. That single step, done early, is what separates a workable IA from one that gets rewritten twice.
3. How to turn an idea into a measurable research question and testable hypotheses
A reliable formula keeps your RQ focused: relationship + measurable variable(s) + location (+ time, if relevant). For example, “How does X relate to Y at [specific site]?” forces you to name exactly what you’re measuring and where, which is what Criterion A rewards according to the IB Geography IA mark scheme.
Here are three vague prompts rewritten into focused research questions:
- Weak: “Investigate urban environmental quality.” Strong: “How does perceived environmental quality change with distance from the central business district along Elm Street?”
- Weak: “Study river processes.” Strong: “How does channel velocity change between the source and the third meander of Willow Creek?”
- Weak: “Look at tourism impacts.” Strong: “How does footpath erosion width vary with visitor proximity to the summit viewpoint on Beacon Trail?”
Once you have a working RQ, operationalize each variable: decide exactly how you’ll measure it, with what instrument, and at what interval. Map your study area on paper or using GIS layers in the Energiewirtschaft sector so the examiner can see the scale and spacing of your sampling points at a glance.
Pro Tip: Write your RQ on an index card and read it before every data collection session. If a method doesn’t directly answer the words on that card, cut it.
4. Field methods and sampling: what to plan, pilot and justify
Primary data for a geography IA typically comes from counts, environmental quality surveys, cross-sections, transects, sediment sampling, noise readings or questionnaires. The method you choose should answer your RQ directly, not just look impressive on paper.
Sampling strategy needs its own justification, not just a label. A few common approaches:
- Systematic sampling works well for spatial gradients, such as taking a reading every ten meters along a transect.
- Stratified sampling suits heterogeneous sites, like dividing a beach into zones before sampling sediment in each.
- Random sampling reduces bias when you’re choosing among many similar points, such as selecting which of forty trees to survey.
- Purposive sampling fits rare or specific features, like targeting the three largest erosion scars on a hillside.
Our guide on sampling methods that examiners approve walks through how to justify each choice against the reliability and feasibility trade-offs examiners expect you to weigh.
Before your real data collection day, run a short pilot. According to examiner-aligned IA guidance, pilot studies test instruments and timing and reveal practical problems before they affect your full dataset. Your pilot checklist should cover:
- Timing: does your data collection fit within the time you actually have on-site?
- Instrument calibration: does your flow meter, clinometer or sound meter give consistent readings on a repeat trial?
- Instruction clarity: will a questionnaire respondent or a second data collector understand your instructions without you present?
- Permissions and safety: do you have access rights to the site and a safety plan for the conditions you’ll face?
In the IA itself, describe your methods in a tight paragraph or two: name the method, the sampling strategy, the sample size, and the justification in a single flowing explanation rather than a long list. Our resource on primary data techniques for IB Geography covers how to write this section without burning through your word count.
5. Data presentation and analysis: tests, maps and examiner expectations
Your choice of chart or map should match the question you’re asking, not just whatever looks neat. Use transect diagrams for spatial change along a line, scatter plots for correlation between two variables, and histograms for size distributions like pebble diameter or housing age.
For statistical analysis, three tests cover most IA needs:
- Spearman’s rank correlation tests the strength and direction of a relationship between two ranked variables, such as distance and environmental quality score.
- Chi-squared tests whether an observed distribution differs significantly from what you’d expect, useful for categorical data like land use types.
- Basic correlation coefficients quantify how closely two continuous variables track each other, such as velocity and channel width.
The value in your analysis comes from interpreting trends and anomalies, not describing graphs. According to IB Geography IA assessment guidance, examiners weigh interpretation far more heavily than description, which is why the suggested word allocation gives roughly 1,200 to 1,350 words to data presentation and analysis alone.
When a data point doesn’t fit the pattern, say so and explain why. An anomalous velocity reading might reflect a submerged obstruction rather than a measurement error, and naming that possibility shows the geographic reasoning examiners look for. Integrate annotated maps and field photos sparingly, with captions that tie each image back to your RQ rather than letting them sit as decoration. Our breakdown of a data analysis workflow mapped to IB criteria shows how to sequence this section so your strongest interpretation lands early.
6. Annotated strong-RQ examples with examiner-style notes
These examples show how a complete plan looks once an idea has been narrowed, piloted and matched to a method.
- Urban: “How does environmental quality change with distance from the central business district along Elm Street?” Method: bipolar survey at ten systematic points along a one-kilometer transect. Analysis: Spearman’s rank between distance and quality score. Limitation: subjective scoring between observers. Improvement: use a shared scoring rubric and average two observers’ ratings per site.
- Freshwater: “How does channel velocity change between the source and the third meander of Willow Creek?” Method: float timing over a fixed distance at five sites. Analysis: line graph of velocity against distance, interpreted against stream order theory. Limitation: velocity varies with recent rainfall. Improvement: record weather conditions and repeat measurements on a drier day.
- Coastal: “How does beach profile gradient vary with distance from the groyne at Site X?” Method: clinometer and ranging pole profile survey at paired sites either side of the structure. Analysis: compare gradient values and discuss in relation to longshore drift theory. Limitation: tidal state affects profile shape. Improvement: schedule all surveys at a similar point in the tidal cycle.
- Tourism: “How does footpath erosion width vary with proximity to the summit viewpoint on Beacon Trail?” Method: path width and depth measurements at systematic intervals, paired with visitor counts. Analysis: scatter plot and correlation coefficient between proximity and erosion width. Limitation: erosion also reflects underlying geology, not just visitor pressure. Improvement: note substrate type at each sampling point.
- Population: “How does housing quality vary with distance from the town center along two contrasting routes?” Method: housing quality index scored at stratified points along each route. Analysis: compare index trends between routes and link to urban models like the Burgess model. Limitation: scoring bias between the two student researchers. Improvement: calibrate scoring criteria together before fieldwork.
- Geomorphology: “How does slope angle relate to visible erosion scarring on the hillside above [site]?” Method: clinometer readings and vegetation cover estimates at ten points. Analysis: correlation between slope angle and erosion scar frequency. Limitation: small sample size limits statistical confidence. Improvement: extend sampling to a second, comparable hillside.
Each of these plans states the method, the analysis and an honest limitation up front, which is exactly what Criterion A and D reward according to the IB Geography IA mark scheme: a research question answerable with field data, tied to a mapped site and a named geographic theory.
7. Common pitfalls and examiner tips from an IB examiner
The same mistakes show up year after year. Here are the ones that cost the most marks, with a direct fix for each:
- Vague RQ: narrow it with the relationship-plus-variable-plus-location formula before you collect anything.
- Unjustified sampling: always state why you chose random, systematic, stratified or purposive sampling for that specific site.
- Description instead of analysis: every graph needs a sentence explaining what it means for your RQ, not just what it shows.
- Weak evaluation: name a specific limitation and a specific, realistic fix, not a general comment like “more data would help.”
- Poor mapping: always include a labeled map showing your exact sampling points, not just a general location.
- Single-method reliance: pair at least two primary methods so your conclusion isn’t resting on one dataset.
- Ignoring word limits: keep your introduction and methodology tight so your analysis section, the one worth the most marks, has room to breathe.
- Skipping the pilot: a short pilot study, even a brief one, gives you evidence to discuss in your evaluation.
Pro Tip: Before submission, read your evaluation section out loud. If it only lists problems without naming a fix for each one, it’s not finished yet.
8. Author perspective: examiner note and next steps
As an IB examiner with over 13 years marking Geography and ESS internal assessments, I can tell you the single highest-impact move is narrowing your RQ before you collect a single data point. Most IAs that lose marks on Criterion A had a workable idea buried inside a question that was simply too broad to measure.
Run your topic through the checklist above, write your RQ using the formula in Section 4, and pilot your instruments before the real fieldwork day. That sequence, in that order, is what consistently separates a solid IA from a struggling one.
— Marija
How Esstutor can help with IA topic refinement and examiner feedback

Turning a rough idea into a research question that survives examiner scrutiny takes a second pair of eyes, and that’s exactly where our tutoring sessions fit. We work through your topic, help you tighten the RQ, choose methods that match your access and timetable, and give examiner-style feedback on your draft before you submit.
If you’re not sure where to start, we offer a trial session to test whether personalized guidance is right for you, and a feedback service that reviews your draft against typical examiner criteria. Both involve one-on-one sessions led by an experienced tutor, so the feedback you get maps directly to how your IA will be assessed.
Check current plans and book a session on our pricing page, or visit our IA tutoring page to see how a single session can reshape a struggling topic into a focused one.
FAQ
What makes a strong IB Geography IA topic?
A strong topic names a specific location, at least one measurable dependent and independent variable, and a clear link to a syllabus theme. Vague or overly broad themes cannot demonstrate the fieldwork design and spatial analysis that examiner guidance rewards under Criterion A.
How long should the IB Geography IA be and how is it structured?
Recommended structure follows approximate word counts for each section, emphasizing a larger portion for data presentation and analysis, with smaller sections for introduction, methodology, conclusion, and evaluation, according to IA structure guidance. The exact word limit and formal requirements are set by the official IB Geography subject guide.
How many primary data methods does a Geography IA need?
Most strong IAs use at least two complementary primary-data methods, such as a field survey paired with a count or measurement, so findings can be cross-checked against each other. This combination also gives you more to discuss in your analysis and evaluation sections.
What sampling method should I use for my IA?
The right sampling strategy depends on your site: systematic sampling suits spatial gradients, stratified sampling suits varied sites, and purposive sampling suits rare features you specifically want to study. Whichever you choose, justify it against the time and reliability trade-offs for your specific location, as explained in our guide to examiner-approved sampling methods.
Can a tutor help me choose and refine my IA topic?
Yes, a tutor who understands IB marking criteria can help you narrow a broad idea into a measurable research question and plan feasible methods before you start fieldwork. Our IA feedback service reviews drafts against the same criteria examiners use, available through our pricing page.
Sources
- IA marking guidance and criteria (IB Geography)
- IB Geography Internal Assessment Guide: Topics & Structure
- Geography SL/HL subject guide (IB)
No Comments